Dow Intraday Charts 08 Dec - 12 Dec

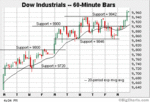
TS - good move - I got stopped out at 9950 from the 9965 long ... still hanging in there on my long from 9885 (just) ...

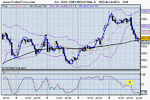
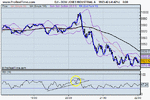
I have a trend line from 21 Nov coming in @ about 9900 will put stops under there & try adding some more around 9910 if seen (I still think we will see another attempt at 10K, possibly as early as tomorrow)
 
Last edited:
SFX - I hope that you make a good profit on your position - I'm very wary of these 'round-trips' that the Dow regularly makes (having been 'had' a few times!!!! :mad: )

A good profit can be eroded all to quickly if you take too much for granted (been there, done it!!!! :( )

Regards
 
TS - I agree about profit being easily eroded...

Luckily I took some profit yesterday @9945 :D Unfortunately I had a limit order in today @ 9995 - which wasn't filled by a couple of pips! :( Still all is not lost (until 9900 breaks that is!)

SFX
 
Doesn't seem be much sign of a serious 'bounce' just yet - the attached chart shows where we might find support (or not!!!)
 

Attachments

  • 09-12-03a.gif
    09-12-03a.gif
    10.7 KB · Views: 320
A word of warning to you all. There are many, many ways to skin a cat. You don't need to know them all. One or two may suffice. Try them all and see which one you get on best with.
What's this got to do with trading? Well, there are no end of indicators you can use. Look at them all, by all means, but DON'T flit from one to another looking for the grail whilst trading. Treat the exercise as homework and learn in the background, whilst trading with what you have learnt and understood so far. Tick and Trin are excellent indicators, but you have to learn what they mean with respect to the DOW. Just remember that each instrument has it's own characteristics and what works with the DOW may/will not work in the same way with something else. Take this on board.
 
10K and back to some sort of support.
Who was it that mentioned a rolling top? TS perhaps? Well spotted. How come you didn't point out the failure? :cheesy:
 

Attachments

  • dow 09-12-03 10.gif
    dow 09-12-03 10.gif
    30.2 KB · Views: 261
Defies analysis, but then that's what we expected didn't we? two tries at 10K and short. Looking at ES Vol., every man and his dog shorted the top. :cheesy:
 

Attachments

  • dow 09-12-03 1.gif
    dow 09-12-03 1.gif
    24 KB · Views: 253
CM,

Returning back to the question posed at the end of last month re: How do we know when the RSI is either going to turn down/up at the extremes?

I find using the smooth Stochastics in the next time frame to be of a great assistance.
 
Last edited:
CM - agree with u re trying out diff things - I'm still sticking and trading to your DOW strategy 'cos it works for me. The TICK stuff is homework / background reading - may be able to use it one day.

Also, quickly realised that it only apples to S&P - there is a TIKI indicator for DOW but that doesn't look very good.

BTW, read in the papers this morining that hedgefunds etc had automated sell orders at 10K - obvious in hindsight !

Nice short at 10K TS - I should have done the same but was feeling too bullish :)

This could be a usefull site for prigram trading info :

http://www.programtrading.com
 
CM.

You'll have to wiat for the example- just removed Updata from my PC with the view to re-installing the latest version & I no longer can post any charts- it must have shared files with other applications, I'll have to see if I can recover the situation :(


Cheers
 
Oaty,

Watcha fella!

What was the Gas meter reading?? 000000 :devilish: another £ saver.

Re Updata.


Just got an e-mail saying that as I am a trial customer Iam entitled to download the latest version 2.1..........


since the last download I have been unable to download any data


Power to System restore- XP :cool: :cool: :cool:

Sh*t- still cannot post any charts :( :( :(
 
Last edited:
CM - 30 min chart seems to give best fit with smoothed stoch- in other words- the signals match the price movement or vice- versa
 

Attachments

  • dow jones industrial a.gif
    dow jones industrial a.gif
    18.4 KB · Views: 403
15 min smoothed stoch clearly demonstrates a lower high with the price double topping
 

Attachments

  • dow jones industrial a.gif
    dow jones industrial a.gif
    23.4 KB · Views: 423
Last edited:
Compared with the 1 min RSI from last nights action. I know this isn't a perfect example - but last nights action didn't provide us with RSI in 1 min mode banging up against the ceiling for very long
 

Attachments

  • dow jones industrial a.gif
    dow jones industrial a.gif
    16.1 KB · Views: 435
lockstock, from your personal experience, do you find the 30min stochastic to be very accurate. I have also been looking at the 60min stochastic, but that only works sometimes.

thanks
anmolway
 
Anmolway,


afternoon,


Looking at the above chart- the 30 min stoch has given all the correct signals- it looks like the best guidance of all the time frames.

It also depends what time frame you are trading in- if you are using the 5 min charts for entry & exit then Elder recommends roughly 5 times that time frame to guage the bigger picture & trade with the longer time frame trend.

Likewise if you are using the 1min time frame then use the 5 min for the bigger picture.

So to answer your question- Yes, but you have to know what you are looking for & use it in conjunction with smaller time frames.


Imnho


Cheers
 
Top