You are using an out of date browser. It may not display this or other websites correctly.
You should upgrade or use an alternative browser.
You should upgrade or use an alternative browser.
counter_violent
Legendary member
- Messages
- 12,672
- Likes
- 3,788
2343.2 ta
nice to see Atilla not gaming the competition this week.
nice to see Atilla not gaming the competition this week.
Pat494
Legendary member
- Messages
- 14,614
- Likes
- 1,588
The combination of US monetary policy tightening and heightened European political risks look set to dominate markets in the coming week. The Federal Reserve is widely expected to raise interest rates, while voters in the Netherlands head to the polls in an election that’s seen as a litmus test for the strength of populist sentiment on the continent in a key year for the EU.
Federal Reserve
Markets fully expect the Federal Open Market Committee (FOMC) will vote to raise interest rates when it convenes on Wednesday. Chair Janet Yellen said recently that a rate hike “would likely be appropriate” at the next meeting.
Faced with Trump’s inflationary policies and a rising stock market, policymakers are concerned that waiting too long to raise rates might require rates to rise rapidly in the future, which could disrupt financial markets and push the economy into recession. Upwards pressure on the front end of the yield curve as inflation expectations rise mean the job is being done by the markets already, so tightening by policymakers should be fairly smooth.
Markets are going to be focused on Yellen’s post-meeting press conference, where we learn a lot more about how quickly the Fed plans to tighten. The dollar has so far not risen as much as might have been expected but this event has the potential – if policymakers more hawkish than previously about future interest rate rises – to spark a further rally for the greenback.
Dutch Elections
Over to Europe, the year of elections kicks off in the Netherlands on Wednesday. Populist Geert Wilders and his Party for Freedom are ahead in the polls and may claim the most seats in the 150-seat parliament, but it is not expected to be able to form a government.
However this election is seen as a litmus test for Europeans’ appetite for populism in the wake of Brexit and Trump, and a surge in support for the far-right might give Marine Le Pen’s FN a fillip ahead of the French elections. The prospect of her emerging victorious has seen French bond yields rise and put pressure on the euro. The elections in the Netherlands are therefore likely to have an impact on European bond spreads and the euro. Immigration will probably be a major factor.
Bank of England
Hot off the heels of the FOMC meeting, the Bank of England is due to make its decision on monetary policy on Thursday. The Bank is widely expected to leave interest rates on hold at 0.25% and the size of its asset purchase programme at £435bn.
Markets will be eyeing any potential shift in tone on growth and inflation as policymakers assess the risks from Brexit and the weak pound. For traders the question that has yet to be fully answered is whether the next move on rates is likely to be up or down. Hawks argue the rise in inflation, which might soon overshoot the Bank’s targets, and a resilient economy mean rates should rise rather than fall. Doves stress the risks to growth and trade as we head towards triggering Article 50.
P
postman
2357 this week please.
sminicooper
Experienced member
- Messages
- 1,148
- Likes
- 329
Simplicity
Attila has kindly invited me by virtue of the competition rules to sound off on whatever topic I like. With respect to my treasured Nazi Box (smuggled out of Germany in 1944 and acquired by me through one of those secret car boot sales that only those in the know are aware of), I suspect that by now most people are: bored to death/reeling in incredulity/can’t afford one/believe it’s a scam. So I won’t mention it again in this piece you’ll be glad to hear. What I would therefore like to bang on about with respect to trading (and it works in many other fields also) is the topic of Simplicity.
Why Simplicity?
Moving to a philosophy of keeping it simple improved my trading no end and although it’s great fun to experiment with all the indicators and EAs, aren’t we into trading to make some dosh? – and don’t mistake that for easy-dosh which is, as far as I can tell, reserved for the Gods of trading (“The Market Wizards”?) of which I’m not one!
How
So what is simple? The simplest thing you can get is price – it doesn’t lag, it doesn’t forecast and it doesn’t necessarily reflect the value of its underlying assets. But it is what we trade and constitutes our raw material. Some people can look at a string of values and mentally interpret them - “tape reading” - (Jesse Livermore was pretty good at that but he ended up blowing his brains out so we won’t go down that route) but most of us find visual interpretation easier. But even then there are ways of making it more complicated – my old and trusty 20th century MetaStock offers me nine different ways of displaying price. So let’s just keep it simple and go for the daily line chart plotting EOD closing prices.
We are keeping it simple – so no indicators (but I’ll let you have just one as a concession, it may well help in the transition to simplicity but possibly not in the way you would think – more about that later). What we will use are straight lines depicting trend, support, and resistance. (If you want detailed instruction on using straight lines, read contributors dbphoenix and The Rumpled One). The only other addition to our chart will be volume – not always essential and not always meaningful but on occasion very useful. Using our lines we can soon identify trends or channels and trade within them – but even that requires a few simple rules:
What are we going to trade? Well, anything that is either in a decent trend (up or down) or has a clearly defined history of ranging – which in itself is a kind of horizontal trend containing mini up and down trends. If when you look at your daily chart you can’t see a trend, then there isn’t one – simply just move on to the next. We need instruments which possess liquidity and volatility enough to generate a worthwhile trade while not being so volatile to cause problems. Forex? – perfectly okay if you can find a suitable candidate, but for me that’s the rub. With a dozen or so major pairs it may not always be possible to find what you want. (On the other hand, just watching a small handful you can get to know them very well and if you are sufficiently patient to wait for the stars to align you may well be rewarded abundantly – that’s all part of practising simplicity). For me, something like the SP500 makes it very simple: there is always a suitable candidate.
When will we enter/exit? In the grand scheme of EOD trend trading, once our straight lines have given us the message to act, it’s not vitally important with respect to time of day and if you are a beginner it may well be simpler to use your scarce (and it is scarce when you are starting out) brain power for other aspects of the trade. However, with a little experience it’s useful to slip down to a much smaller timeframe to refine your entries and exits – with practice you can squeeze extra mileage out of the trade. But the important thing is to act, once the straight lines have told you to do so. Part of our simplicity mode is to normally live within the daily timeframe.
So that’s our modus operandi sorted out! But we need to test it and that’s where the fun starts – and I do mean that in the sense of enjoying ourselves. If we are a beginner we want to learn how to trade profitably and safely without blowing up our account; if we are an experienced trader it would be nice to demonstrate that we can take those aims in our stride.
The Micro Account
In my quest for simplicity I’ve become a fan of the Micro Account. (NB. This is not about day trading which is a completely different ballgame.) Let’s specify a starting capital of £1000. Yes, it’s well undercapitalised and any misuse or bad practice will soon have you in the debtor’s prison. But that’s why it’s a good learning tool and test of your skill: you can only succeed with this account if you do things right. And you will learn that discipline is essential to success. The aim is to double our capital in 12 months. It’s going to take a fair while to accrue even a deposit for the yacht but on the other hand, if you can make this achievement in a calm and regulated manner then you should be able to scale it up considerably. The yacht then becomes a possibility for those who are patient!
This is our game plan: we’ll start off paper trading – when we can do that properly we can go live. We’ll take our entry/exit prices from the broker’s live feed – if we use spread betting (SB) we can forget commissions et cetera but will still need to take account of dividends and other minor costs. When paper trading SB we will need to deduct appropriate margin from our capital – that’s easily calculated by opening a trade ticket without actually executing it, otherwise you can calculate it yourself.
If we are to trade safely and not wipe out our account then it’s essential to have some safety rules in place. Just as in the aviation world where pilots have limits to ensure safety (break them and you will surely end up in serious trouble) we must do the same. Here are the safety limits I recommend for the Micro Account. Note: I define risk as the amount of money that will be deducted from the account if that limit is breached.
You may think that these limits are very restricting. Well, they are and they are designed that way to keep you in business. You would have to be completely reckless to trash the account. It should become apparent fairly early on if you are not trading well and the idea of the limits is to make you realise that, before the situation gets seriously out of hand.
I did say previously that you would be allowed one indicator as a concession. (My favourite would be the Welles-Wilder PSAR which is ideally suited to trending situations. It gives nice confirmation of a trend and even suggests an adaptive stop.) However, that’s not the point. Just plot your favourite indicator and observe it – don’t use it in your trading. You will then see firstly, that you don’t need it and secondly, that it can give erroneous messages or inappropriate timings. Look carefully and you will see its limitations. Ironically, once you reach that stage that is the very time when you will be able to squeeze some little use out of the indicator despite not needing to do so!
You will have to be patient to be successful with the Micro Account as I’ve postulated. But hopefully it will make you cautious and think very carefully about what you’re doing with each trade. If you can double your money in 12 months without going bust, without having sleepless nights and develop a feeling of confidence and control, then I think you’re probably doing okay. I know that the aims of the Micro Account can be achieved because I’ve done it myself. Expert traders will be able to do a lot better.
🙂
Attila has kindly invited me by virtue of the competition rules to sound off on whatever topic I like. With respect to my treasured Nazi Box (smuggled out of Germany in 1944 and acquired by me through one of those secret car boot sales that only those in the know are aware of), I suspect that by now most people are: bored to death/reeling in incredulity/can’t afford one/believe it’s a scam. So I won’t mention it again in this piece you’ll be glad to hear. What I would therefore like to bang on about with respect to trading (and it works in many other fields also) is the topic of Simplicity.
Why Simplicity?
Moving to a philosophy of keeping it simple improved my trading no end and although it’s great fun to experiment with all the indicators and EAs, aren’t we into trading to make some dosh? – and don’t mistake that for easy-dosh which is, as far as I can tell, reserved for the Gods of trading (“The Market Wizards”?) of which I’m not one!
How
So what is simple? The simplest thing you can get is price – it doesn’t lag, it doesn’t forecast and it doesn’t necessarily reflect the value of its underlying assets. But it is what we trade and constitutes our raw material. Some people can look at a string of values and mentally interpret them - “tape reading” - (Jesse Livermore was pretty good at that but he ended up blowing his brains out so we won’t go down that route) but most of us find visual interpretation easier. But even then there are ways of making it more complicated – my old and trusty 20th century MetaStock offers me nine different ways of displaying price. So let’s just keep it simple and go for the daily line chart plotting EOD closing prices.
We are keeping it simple – so no indicators (but I’ll let you have just one as a concession, it may well help in the transition to simplicity but possibly not in the way you would think – more about that later). What we will use are straight lines depicting trend, support, and resistance. (If you want detailed instruction on using straight lines, read contributors dbphoenix and The Rumpled One). The only other addition to our chart will be volume – not always essential and not always meaningful but on occasion very useful. Using our lines we can soon identify trends or channels and trade within them – but even that requires a few simple rules:
- Trade long or short in accordance with general market trend. If it’s ranging then you can do either, dependent on the chart of your chosen instrument.
- Most established trends end up being depicted in a channel of some kind. Enter your trade at the channel boundary favouring your direction of profitability e.g. in a trending up channel you would go long when the price bounces off the lower channel. (If you do it vice versa you will reduce your advantage).
- Volume – keep an eye on average volume and note when actual volume deviates. There’s usually a reason and it can reinforce your conclusions of what’s happening to the trend. Yahoo financial quotes average volume but you can easily plot this yourself (65 period sma overlaid on a vertical column chart of volume works well for me). This is a good instance of using an indicator for clarification rather than a forecast – which is what we are trying to avoid.
What are we going to trade? Well, anything that is either in a decent trend (up or down) or has a clearly defined history of ranging – which in itself is a kind of horizontal trend containing mini up and down trends. If when you look at your daily chart you can’t see a trend, then there isn’t one – simply just move on to the next. We need instruments which possess liquidity and volatility enough to generate a worthwhile trade while not being so volatile to cause problems. Forex? – perfectly okay if you can find a suitable candidate, but for me that’s the rub. With a dozen or so major pairs it may not always be possible to find what you want. (On the other hand, just watching a small handful you can get to know them very well and if you are sufficiently patient to wait for the stars to align you may well be rewarded abundantly – that’s all part of practising simplicity). For me, something like the SP500 makes it very simple: there is always a suitable candidate.
When will we enter/exit? In the grand scheme of EOD trend trading, once our straight lines have given us the message to act, it’s not vitally important with respect to time of day and if you are a beginner it may well be simpler to use your scarce (and it is scarce when you are starting out) brain power for other aspects of the trade. However, with a little experience it’s useful to slip down to a much smaller timeframe to refine your entries and exits – with practice you can squeeze extra mileage out of the trade. But the important thing is to act, once the straight lines have told you to do so. Part of our simplicity mode is to normally live within the daily timeframe.
So that’s our modus operandi sorted out! But we need to test it and that’s where the fun starts – and I do mean that in the sense of enjoying ourselves. If we are a beginner we want to learn how to trade profitably and safely without blowing up our account; if we are an experienced trader it would be nice to demonstrate that we can take those aims in our stride.
The Micro Account
In my quest for simplicity I’ve become a fan of the Micro Account. (NB. This is not about day trading which is a completely different ballgame.) Let’s specify a starting capital of £1000. Yes, it’s well undercapitalised and any misuse or bad practice will soon have you in the debtor’s prison. But that’s why it’s a good learning tool and test of your skill: you can only succeed with this account if you do things right. And you will learn that discipline is essential to success. The aim is to double our capital in 12 months. It’s going to take a fair while to accrue even a deposit for the yacht but on the other hand, if you can make this achievement in a calm and regulated manner then you should be able to scale it up considerably. The yacht then becomes a possibility for those who are patient!
This is our game plan: we’ll start off paper trading – when we can do that properly we can go live. We’ll take our entry/exit prices from the broker’s live feed – if we use spread betting (SB) we can forget commissions et cetera but will still need to take account of dividends and other minor costs. When paper trading SB we will need to deduct appropriate margin from our capital – that’s easily calculated by opening a trade ticket without actually executing it, otherwise you can calculate it yourself.
If we are to trade safely and not wipe out our account then it’s essential to have some safety rules in place. Just as in the aviation world where pilots have limits to ensure safety (break them and you will surely end up in serious trouble) we must do the same. Here are the safety limits I recommend for the Micro Account. Note: I define risk as the amount of money that will be deducted from the account if that limit is breached.
- Maximum risk on any one trade = 10% of account capital. This fits in quite nicely with a guaranteed stop loss (I use IG and 10% is their usual). Do note that this is a nominal stoploss only, used for purposes of risk management (it also shields you from opening spikes and other suchlike shenanigans). Your practical stoploss (the place where you know the trade is no longer viable) is known only unto you & your maker – so you won’t be able to blame the broker!
- Maximum risk on all open trades = 50% of account capital.
- Maximum drawdown allowed = 15% of account capital.
You may think that these limits are very restricting. Well, they are and they are designed that way to keep you in business. You would have to be completely reckless to trash the account. It should become apparent fairly early on if you are not trading well and the idea of the limits is to make you realise that, before the situation gets seriously out of hand.
I did say previously that you would be allowed one indicator as a concession. (My favourite would be the Welles-Wilder PSAR which is ideally suited to trending situations. It gives nice confirmation of a trend and even suggests an adaptive stop.) However, that’s not the point. Just plot your favourite indicator and observe it – don’t use it in your trading. You will then see firstly, that you don’t need it and secondly, that it can give erroneous messages or inappropriate timings. Look carefully and you will see its limitations. Ironically, once you reach that stage that is the very time when you will be able to squeeze some little use out of the indicator despite not needing to do so!
You will have to be patient to be successful with the Micro Account as I’ve postulated. But hopefully it will make you cautious and think very carefully about what you’re doing with each trade. If you can double your money in 12 months without going bust, without having sleepless nights and develop a feeling of confidence and control, then I think you’re probably doing okay. I know that the aims of the Micro Account can be achieved because I’ve done it myself. Expert traders will be able to do a lot better.
🙂
pingpong1965
Well-known member
- Messages
- 301
- Likes
- 23
2370 please
sminicooper
Experienced member
- Messages
- 1,148
- Likes
- 329
2352.98 Please.
I just asked her Ladyship to select a random number 2350 -2380 and added the first two decimal points that came into my head. Worked all right last week 😆
I just asked her Ladyship to select a random number 2350 -2380 and added the first two decimal points that came into my head. Worked all right last week 😆
Atilla
Legendary member
- Messages
- 21,115
- Likes
- 4,304
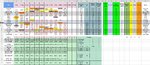
There you go all you fab forecasters...
Start of Week 11 and we have 9 bears v 6 bulls. Oscar the bear is squaring up to Signalcalc the bull with a variance of 69 points. Usually, the ATR is half so on average I'd pencil a 35 point rise/fall either way if stats anything to go buy.
Interesting observation, most of our forecasters are contrarians. Whilst the markets have been trending up and making new highs on average we've had 10 bears v 6 bulls.
Wishing you all prosperous trading and happy days 👍
Attachments
P
postman
2357 this week please.
Ahem!
Atilla
Legendary member
- Messages
- 21,115
- Likes
- 4,304
Ahem!
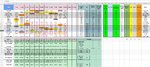
Ooopsy and so so sorry 😱😱😱
I'm sure there is a lag in updates... Have to do it slower. Blame googledocs.
Updated...
Attachments
P
postman
Merci beaucoup.
P
postman
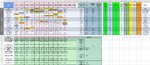
Mid-week and we are finally on the right side of the line for step up.
I have SPX at PP-R1 @ 2374
Fed hike pencilled in. Steady as she goes. 👍
Good job you only pencilled that in. 😀
Attachments

Atilla
Legendary member
- Messages
- 21,115
- Likes
- 4,304
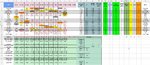
Hey guys,
I was going to suggest as it is close at the top, sealed bids come into play.
So if you would like to enter sealed forecast, please forward to Pat and/or Postman they can hold them in confidence until markets open.
That way strategic voting if a concern can be removed.
All the best 👍
I was going to suggest as it is close at the top, sealed bids come into play.
So if you would like to enter sealed forecast, please forward to Pat and/or Postman they can hold them in confidence until markets open.
That way strategic voting if a concern can be removed.
All the best 👍
Similar threads
- Replies
- 989
- Views
- 142K
- Replies
- 1K
- Views
- 193K
P
- Replies
- 2K
- Views
- 233K
P
- Replies
- 908
- Views
- 140K
- Replies
- 873
- Views
- 352K