FTSE100 Intraday Trading - September 03

mornin' bonsai et al

see you've changed logos again - it'll be a record fish next?

back on the overnight boat - all in order now.

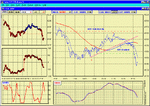
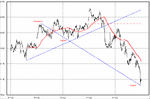
what's the question? barc have had a good run lately so
suffered most, but bounced nicely (if not too convincingly
yet) from eod fib @ 470

on ftse major fib @ 141 seems to have held? need a run up
beyond 240 then your 280 for bulls to breathe easy again?

good trading

jon
 
here is the chart, but if you go here you should be able to set up your own
<a href="http://uk.finance.yahoo.com/q?s=^FTSE&d=c&k=c3&c=BARC.L&a=v&t=5d&l=on&z=l&q=l">Yahoo</a>
.
<img src="http://cchart.finance.ukl.yahoo.com/z?s=^ftse&c=BARC.L&a=v&t=5d&l=on&z=l&q=l&i=uk">
 
Bonsai.
Thanks Bonsai,I can do that now.
I thought we should have a bounce off 130 to 145,am waiting for a pull back (snake).

LOL and keep out of the horse road!!!.
 
well, today did not go according to plan but started off all right.
but that is whywe all have a trading system, right ?
quite profitable thanks to the usual 2 swings.
nice break of the Gann Line.
 

Attachments

  • sep29.gif
    sep29.gif
    30.5 KB · Views: 325
Last edited:
mornin' all

sounds good, bonsai.

thought for the day : Even if you are on the right track,
you'll get run-over if you just sit there.

good trading
 
No trading for me today but after the es yesterday I don't have to.I read on elite trader of a chap who only trades 6times/month.I think I'll try something similar with ftse -- only trading when I recognize something large.
 
6 trades per month ?
20day month ?

sounds like the 3 day sma might suit you ?
or even 2 day and be selective?
 
bonsai

do you use fibs on intraday moves? also, how do you rank
fibs in terms of anticipated significance (eg: I would guess
those running from your EW troughs and peaks to be of
greater significance than those running from intermediate
troughs and peaks)?

jon
 
barjon
I dont use intraday moves to calc intraday fibs, if you see what I mean

today I did use fib 4191/4137/50%=4164
but that was a fib based on yesterdays range.

on ranking.
the concept is that each elliott leg corrects to its own fib
until the wave is complete then the wave corrects to its own fib.
so it tends to be a chronological sequence.
 
mmm, thanks

I really will have to get to grips with this EW business. I
understand the basics ok but always have difficulty trying
to see it all as it unfolds rather than in hindsight.
 
It's lucky I haven't got such an overwhelming belief in my own skill that I didn't go long and leave it without a stop.
 
they really were giddy heights ?

but if you have been following my approach, you may have been looking for a 'resistance ' line or in this case a 'support' line.
I hope you found it.

I hope this chart is self explanatory as it follows the principles
I have referred to before.
AND of course, we are now bang on the bottom channel line.

so we have reached a critical point. If it fails, even I may become bearish !
:LOL:
 

Attachments

  • cwave.gif
    cwave.gif
    16 KB · Views: 334
Hi everyone
just wondered if anyone knew if Fibonacci retracement is correctly used on log or linear scale charts. For example ive got 4082 as the 23% level on Footsie in Linear and 4055 in Log (march-sept rally),but looking at the way it bounced of 4082 today the answer could be linear what do you guys think
 
Money
I have never used log calcs.
Dont use 23% either.
And wouldn't recommend it.

But if it works for you , use what works !

Dont think it stopped today because it hit 23%.
 
Top