Hi Bonsai,
Yep, case of fools rush in- this am.
More of a turn around on the day- it must have been up over 1% at some point during the day- agree with continuation of overall trend.
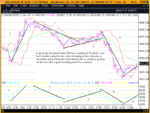
60 min chart actually gave a buy signal @ 4050.
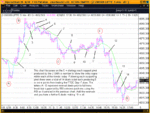
Yep, you're right on the break even bit. Oh so nearly closed at 4070 for a small loss when I popped back. 'cos it did look like a bottom @ 4065 ( which in hindsight thankfully I just missed )then a slightly higher low @ 4071- hate loosing even 5 or 6 pts. The rest played out as I thought & hoped it would lower high @ circa 4085 & then a rapid descent :cheesy:
Was wrong about the Dow- now @ 9051/6


