You are using an out of date browser. It may not display this or other websites correctly.
You should upgrade or use an alternative browser.
You should upgrade or use an alternative browser.
- Status
- Not open for further replies.
just interested Hooya but why do you trade the cash as opposed to the futures?
i was trading ftse futs on spreads (i assume you use spreadbets) but have just moved to the actual futures for better execution and narrower spreads. never looked at the cash but always interested in other viewpoints
splash
i was trading ftse futs on spreads (i assume you use spreadbets) but have just moved to the actual futures for better execution and narrower spreads. never looked at the cash but always interested in other viewpoints
splash
Just got back from Easter holidays ( in a part of Devon that The Times singled out as an area to get away from all modern means of communication-is my wife trying to tell me something?)and, once again, found the FTSE thread had fizzled out.
So here is my attempt to get things going again and put the thread back on to screens.
Western Equity markets remain trapped in consolidation since end of January (NASDAQ). Struggle between valuation and prospect of rising interest rates?
Rally, after an ABC correction, from 24/03/04 still appears in progress with the FTSE100 outperforming its sibling FTSE250. Defensive pharmaceuticals, tobaccos and beverages taking up the running last week as US long term interest rates continued to climb.
Therefore, IMHO if feels that, as long as investors are worried about the prospect of rising interest rates, the defensive nature of the FTSE100 will have attractions.
Note also how Shell is now absorbing any bad news with the departure of its CFO and another reserve downgrade not hurting the share price this morning.
Attachments
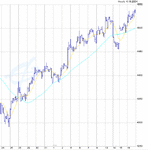
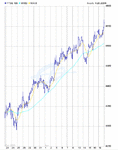
Re my reference to Western equity markets in consolidation since end January, here is the FTSE World index ($) to illustrate the point.
I use the ADX to highlight whether a trend is in operation. The ADX peaked at the end of January and has been in decline ever since signifying consolidation.
I use the ADX to highlight whether a trend is in operation. The ADX peaked at the end of January and has been in decline ever since signifying consolidation.
Attachments
hi all
not back for long but how is it going ?
I see it did much as I was suggesting ?
tested the trend line without really breaking the fib !
so what's in play ?
I have 2 significant spikes on my chart. First about 4550+
and the other eached to 4570+
unless we know they were mistakes, I would expect these levels to be tested.
My hourly chart suggests the next target might be 5114 but obviously I dont expect us to get there in a straight line !!!
Greenspan this week !
well we should hit that gap tomorrow at 53. After that all major gaps are to the downside. Good to see some good posters still about. All gone abit quiet on the BBs again. It seems to go through waves (lol) of being busy and then quiet. I, myself, am spending more time looking at other markets to add a few more strings to my bow.
Must admit that the FTSE has me flumoxed at present with it's strength.
I broke my rule to stick to the plan and didn't get out of my short at the predefined point of 4468 and cursed it back up.
Bought at 4480 and 4496 fortunately and have been flat during this rally.
Can't force myself to buy here so waiting for signes of weakness to instigate new short
Guess it may try to hit previous high shortly which i have at 4558 (June Futs)
Splasher,
Know your weights of the major stocks in the FTSE 100 and how they are performing. The run up since March 24th has been led by the oils and pharmaceuticals:
Stock Mkt Cap
BP Amoco 109.185bn +12.5%
Shell 37.969bn + 9.7%
AZN 44.995bn +3.8%
GSK 69.078bn +8.2%
and
Vod 90.739bn +9.8%
Diageo 23.481bn +8.0%
FTSE 100 +5.5%
Hope this helps
Splasher: FTSE 100 weightings
FTSE 100 weightings 16/04/2004
Stock Mkt Cap bn FTSE 100 weighting
BP Amoco 109185 10.1%
Vodafone 90739 8.4%
HSBC 89969 8.3%
GlaxoSmithkline 69078 6.4%
RBOS 49611 4.6%
AstraZeneca 44995 4.2%
Shell 37969 3.5%
Barclays 31877 3.0%
HBOS 28299 2.6%
Diageo 23481 2.2%
LloydsTSB 23243 2.2%
TOP 11 stocks 55.5%
Must admit that the FTSE has me flumoxed at present with it's strength
Can't force myself to buy here so waiting for signes of weakness to instigate new short
Splasher
go with the flow ?
it never pays to fight the market
go with the trading trend
we are NEVER likely to know why a market is strong or weak until it is too late. And it shouldnt matter anyway. We are trading Charts ? not fundamentals !
- Status
- Not open for further replies.


