Here we go again.
........and this is after.
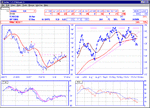
the 'rapid climb' turned into a new high, but promptly went into
correction mode with an A/B and very sharp C.
still trying to recover, by the looks of it.
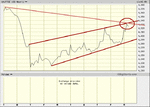
We seem to have hit and been thrown back by the resistance at 4330 but a bit of base building on friday afternoon ?
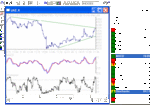
The candle charts for the last 6 days do not look encouraging
but 4450 still looks achievable in the short term.
Value is clearly now centred around 4285.
<a href="http://uk.search.news.yahoo.com/search/compnews_ukie?p=ytic:_ftse&z=date">FTSE 100 daily news</a>
Attachments
Last edited:


