You are using an out of date browser. It may not display this or other websites correctly.
You should upgrade or use an alternative browser.
You should upgrade or use an alternative browser.
- Status
- Not open for further replies.
well didn't see that coming.................closed shorts yesterday and was looking for long entry point but thought futures rally from 28 to 40 would run out of steam giving me chance to enter at 30, no such hope so i've watched it steam ahead from sidelines, sell order in at 83 was missed by a whisker but seems to have fallen short for moment si order cancelled
what are feelings now, new highs with an eye on 00??
what are feelings now, new highs with an eye on 00??
if you didnt see that splasher, it may be you need to think about your indicators ?
ftse was rising for most of the day, my macd was bullish with higher low,and RSI bottomed and a/d line confirmed thw whole move.
the simple key was breaking the gain line ?
ftse was rising for most of the day, my macd was bullish with higher low,and RSI bottomed and a/d line confirmed thw whole move.
the simple key was breaking the gain line ?
a trend line hit at 600.
Bonsai you have to remember you have great advantage by being very clued up in EW theory. It does obviously help you stay in atrade longer and also gives you "possible move" before the move happens. I was long yester day at 22 but closed way to early... but I bet I have been watching the count I would have been quids in.
Bonsai you have to remember you have great advantage by being very clued up in EW theory. It does obviously help you stay in atrade longer and also gives you "possible move" before the move happens. I was long yester day at 22 but closed way to early... but I bet I have been watching the count I would have been quids in.
leeshindig
Active member
- Messages
- 140
- Likes
- 0
Hi bonsai.....
good to see you back on the thread, hope all is well.
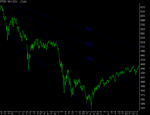
here is a fib fan from the high to the low. On hitting both fan lines there has been a near exact same reaction...swift retrace followed by smashing straight through and onto new highs.
If the target is the next fanline then it stands at 5070..ish...
Which is also around the support area of late 01 and early 02...
Been interesting following it..
regards Lee.
Attachments
A look a FTSE100 stock contributions.
Splasher,
I have revived some work I used to do in a professional capacity years ago.
In looking at the FTSE100, it is always worth being aware
what the underlying charts of the top ten stocks are suggesting.
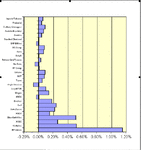
As an example, the FTSE100 has risen nearly 5% from 26/03/04.
68.5% of that move was accounted for by the biggest 10 stocks in the FTSE100.
75% of the move was accounted for by the top 20 stocks.
I have included an excel chart to illustrate the make up of the 4.9% increase in the FTSE100.
As the chart makes clear BP Amoco was easily the biggest factor
in the FTSE 100 performance contributing over 23% of the total move.
Hope this is useful and goes someway to answer your surprise at the recent strength of the FTSE100.
Attachments
Hi Lee, fine thanks
It feels like quite some time since I put up a working chart, so here is mine for last few days.
a couple of comments ?
swing reversal on thursday picked off by higher low on macd
and confirmed on break up through zero (jonnyy !)
also break up through break line from previous correction
and of course reversal of 1day sma close to the low.
a/d line held up - just - and after the snake up at the pretty numbers should have given you a short for the day (especially as it was also a gap fill !)
gap fills off pretty numbers are something of a gimme !
RSI still "up there" so this correction may or may not have finished.
fib is at 4563
LATER EDIT
seems I have moved my fib too quickly - it is still at 4567
(assuming we are now in 4 of something)
Attachments
Last edited:
- Status
- Not open for further replies.


