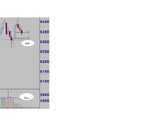
FTSE 100 Intraday - November

Status
Not open for further replies.
I don't see a move back toward 4400 as unlikely but wouldn't like to speculate as to where it might falter.

A new high will force my views to change but until then I see a downtrend being established, with the recent high and whatever rally now materialises forming the top of that trendline.
 
no frost, greens holding, sun shining, won the back half and the
match and all is right with the world.

hooya - absolutely, so long as your "indicator probability" doesn't
tempt you to bend your trading rules - it's a shame I'm so easily
tempted.
 
Bonsai - I can't see a clear wave-count, only that it bounced almost on the 61.8 retrace. Can you shed any light on potential counts?
 
bonsai

unfortunately yes.... off 11 which is a damn sight better than me

she's good at picking shares too, but I'm MUCH better at losing
money.
 
hb
I have to declare a bias.
like fotheringham, I think the top is in for the time being
so I am looking for potential failure points.
however having said that, I judge that the low today was a 5th
(after an extended 3rd ?) so probably 'A' but could be 1.
The previous pattern into 4380 looked incomplete so I can see a return to that level.(its also about 50% pullback ?) 'a' ?
or if we dont get there soon it might be on the 'c' leg of 2.

but it all got very difficult over the last couple of days.
so this is no more than a working plan.
(just closed my short futures)

I'm not even picking up any 'pattern recognition' at the moment.
(except the dax seems to have also completed a 5.)

so finger in the air .......
 
but FTSE has dicounted a bit already so unfortunately the US might be a better short at 820-30ish imo but early clsoign today as well over there. so treding carefully
 
Bonsai, thanks for your view. I dont expect a new high next week either, but until wee break a previous significant low I'm remaining open minded.

Also agree about Dow - just shorted at 9791 (futures)
 
another uncertainty candle with a stand-off twixt bulls and bears.
Not so in last half hour or so when some decent volume came in
(on the selling side - must be) and went down 12 while dow was
only going down 10.

Candles interesting at the moment but confusing because of the
low volume (all week). hope to post more over week-end.

Bonsai

1. with that up then down gap - how long at the high point?
an abandoned baby would be (was) significant?

2. How do you get more than one chart in the single post? Just
post a groan if you think it'd be too complicated for me!!!
 
barjon
don't think I can help with the baby.
I only take a plot every 2 mins.
I'll put up a chart over the weekend.

charts
(groan): lol
because t2w only allows 1 chart per post, you would have to do it all in Paint.
what is involved is first getting the charts down to the right
size and increasing the Paint frame to full size.
then when you paste the first into Paint, move the chart over to the right so that it takes up less than half the width of your frame.
then edit paste your second chart and it will appear on the left side of the frame.
it can be a bit tricky if they overlap.
if it works first time, Save it .
You can then move each chart to tidy up your presentation.
When you have finished , convert it to gif.

It's some time since I did all that so fingers crossed.

There may be other ways of doing it, but they probably require
additional software.
 
let me know when you have seen them as both images are
quite large in pixel terms and for 56ers will be slow to load.

then I will take them down

PS: charts seem to use up a lot less pixels if you have a white background

moving them around only involves using 'select tool' to create
a rectangle around the object and then dragging it.

remember to move the frame back to the minimum size necessary
before you save and convert
it makes a big difference to the eventual size of the posted pic.
 
Last edited:
thanks bonsai, I'll play around with paint :rolleyes:

expect something from me after Christmas :LOL: :LOL:
 
The key candlestick this week was the long rising candle on
Monday. It was particularly important because it was a bounce
off fib50 support, but a little worrying because it was on very
low volume. Such a strong candlestick should give first level
support (S1) half way down and strong support (S2) at its base in
any pullback.

Then came the stalled pattern signifying a loss in upward
momentum with Tuesday's candle having a high shadow BUT the
low volume indicated lack of continued buying pressure rather
than bears flying in. Wednesday and Thursday again showed
uncertainty with high shadows and low volume, but S1 held.
Friday and a whisper of trouble as S1 gave only to recover but
fail again near the close (on markedly increased volume during
the last session - bears or weekly long closers in play?) increasing
the whisper to a muted shout. The real shout will come if S2 goes.

Even with that last volume hike daily volume was very low all week.
No strong buying to start it but enough to push it higher
each day (absence of sellers?) before falling under its own weight

as buying dried up.

I'll try to post monthly, weekly, daily and intraday patterns
together over week-end and it'll be interesting to see how it fits
in with all you wave surfers
 

Attachments

  • longwhite.gif
    longwhite.gif
    6.4 KB · Views: 289
Last edited:
barjon
here is the 2 min dot chart I promised.
sorry there is no time stamp on the x axis.
covers the last 3 days with 2hr breaks.
 

Attachments

  • dot.gif
    dot.gif
    15.9 KB · Views: 276
Status
Not open for further replies.
Top