socrates I think you will find none of here on this thread are interested in anyone's predictions for the future.Specifically what may or may not happen tomorrow, or next week or next year, as opposed to what may or may not happen in the next few minutes on a given instrument.
You are using an out of date browser. It may not display this or other websites correctly.
You should upgrade or use an alternative browser.
You should upgrade or use an alternative browser.
SOCRATES
Veteren member
- Messages
- 4,966
- Likes
- 136
Oh ! That's marvellous Chartman, thank you indeed. What relief ! Phew !ChartMan said:socrates I think you will find none of here on this thread are interested in anyone's predictions for the future.Specifically what may or may not happen tomorrow, or next week or next year, as opposed to what may or may not happen in the next few minutes on a given instrument.
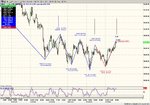
It seems us Techinal traders have been at it again......
I tryed to point this out last time.......so I took some screen shots to try and make things clearer :?:
Comms are providing the short interest ...
I tryed to point this out last time.......so I took some screen shots to try and make things clearer :?:
Comms are providing the short interest ...
Attachments
SOCRATES
Veteren member
- Messages
- 4,966
- Likes
- 136
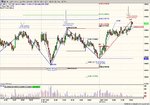
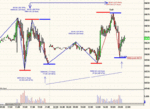
Posted charts No 36 on this thread:~
First of all there is very little crossing activity between between both charts, which means that the pros are not playing an active part. This is a characteristic of a lazily meandering rangebound market. It does not have enough fizz in it in the latter part to attract the attention of really serious players, also the clue is that the volume is erratic.
Secondly every top from 1630 onwards is a steep top, whether the timeframe captures it as a candle with a toptail or an up candle followed by a down candle is the same. This means there is no interest in higher prices, and whatever interest there is, is fleeting and soon over.
Thirdly each of these is lower than the previous, hence this does not imply strength whether overt or covert.
Fourthly when all of this is examined closely, the volume that appears at 1530 is not buying but arresting.
Also in every decline there are lots of top shadows. All this indicates that the price is being allowed to drift.
It would need really serious buying to stop this decline at this stage to reverse it, therfore at best this can be expected to remain rangebound until conditions change.
sall said:a320, would you mind explaining you're chart a little more to some of us who are not so technical and learning to climb the rope upside down?!!
Hopefully the charts will explain how the technical traders look for these corrective "measured moves" of waves of similar degree.. All I wanted to do was make people aware so they have another mechanical tool in which to draw on if they so wish..
😉justyn said:And if it was all so obvious what should we expect / look for on Monday?
Justyn.
...................................
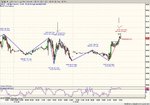
Update for the YM seen as its the Dow thread ( ES trader myself)
CJ
Attachments
Last edited:
SOCRATES
Veteren member
- Messages
- 4,966
- Likes
- 136
All these "corrective" - "measured moves" of "waves" of "similar degree" you imply are patently clear without the added harness,surely.
They are patently clear to anyone capable of reading price action and understanding the use of time and volume:~
At least they are patently clear to me, if to no one else.
But however, the superflous harness serves to confuse people.
Why do you insist on complicating what is basically simple?
What is the purpose of including ratios and percentages and so on ?
What are all these non relevant cryptic creations to serve ?
Why are you doing this, and to what end ?
It may serve to baffle and impress others but I can assure you, it does not impress me at all, if that is what you are trying to do.
I am curious as to why you should try to attract attention to what is patently obvious as you say, in this way ?
We were treated to a lot of hierogliphics in No Indicators as well, and greek Mythology, so what are you on about now ?
In case anyone thinks this is aggression, it is nothing of the sort, just bemused curiosity, that's all. And all of this in the middle of such a serious topic, as well.
Kindest Regards.
SOCRATES
Veteren member
- Messages
- 4,966
- Likes
- 136
Chart on Post number 45, above.
In the absence of a reasonable structured set of answers to my questions , here is the volumetric synopsis for the above.
If you look on the volume surges within volumetric flow during trading, you will see there is volume alternating both on tops and on bottoms. This is because it is being sold on tops to bring it down, only to buy it back and send it up again, as part of a sequential strategy to maintain the price within a given range, it is that simple, really, no more, no less.
TheBramble
Legendary member
- Messages
- 8,394
- Likes
- 1,171
Mods/T2w team/Admin - can I suggest you apply the same application of 'thread purity' to this thread as you did to others over the weekend?
The post before last has nothing to do with te subject posed by the thread-starter.
Or are we going to witness another bout of moderator (or t2w-team with no mod status but I'll mod anyway) bias?
The post before last has nothing to do with te subject posed by the thread-starter.
Or are we going to witness another bout of moderator (or t2w-team with no mod status but I'll mod anyway) bias?
SOCRATES said:They are patently clear to anyone capable of reading price action and understanding the use of time and volume:~At least they are patently clear to me, if to no one else.
Each to their own....
The same question could be equally appropriate to your good self.......As for me I'l let others judge my character & the reasons why I post.....SOCRATES said:Why are you doing this, and to what end ?
SOCRATES said:It may serve to baffle and impress others but I can assure you, it does not impress me at all, if that is what you are trying to do.
Did I mention ego's above.....?
SOCRATES said:We were treated to a lot of hierogliphics in No Indicators as well, and greek Mythology, so what are you on about now ?
Come on SOCRATES , your showing a little ignorance regarding the more esoteric side of things .....😉
Have a pleasant evening...
CJ
SOCRATES
Veteren member
- Messages
- 4,966
- Likes
- 136
This is not a structured technical reply, very disappointing indeed.
Kind Regards to you As Usual and have a Good Evening.
Kind Regards to you As Usual and have a Good Evening.
a320 said:Each to to they own....
The same question could be equally appropriate to your good self.......As for me I'l let others judge my character & the reasons why I post.....
Did I mention ego's above.....?
Come on SOCRATES , your showing a little ignorance regarding the more esoteric side of things .....😉
Have a pleasant evening...
CJ
Nothing new in 320's charts- that's how he always posts them.I don't think anyone here is impressed by anything, nor out to impress anyone else. We're beyond that. A simple explanation as to volume re post 47 is more than enough for all to understand.( I hope)
SOCRATES
Veteren member
- Messages
- 4,966
- Likes
- 136
It has a lot to do with it. When members need to ask for a chart to be explained in terms of what it displays, and the poster does not explain how it is he arrives at conclusions, and the chart is decorated also with all sorts of harnesses that do not make sense. In the end it is those of us who are capable of explaining who are left to do it, and we have a right to ask as to why all these decorations are necessary in order to arrive at conclusions that are simple really, if not patently obvious.TheBramble said:Mods/T2w team/Admin - can I suggest you apply the same application of 'thread purity' to this thread as you did to others over the weekend?
The post before last has nothing to do with te subject posed by the thread-starter.
Or are we going to witness another bout of moderator (or t2w-team with no mod status but I'll mod anyway) bias?
The time is now 0017 hrs.
I have just remembered something else, because this will help you:~
If you look carefully, you will see how it is that the volume declines on ascents. This is as a consequence of there being no significant demand, leading to tops; and on declines, the volume also declines. This is as a result of supply into the market being exhausted leading to bottoms. This tells us that the amount of available supply and available demand is temporarily limited.
This completes the explanation so that you are able to understand all of it within a meaningful and constructive context of the volumetric flows in play at the time, as part of the whole picture.
Last edited:
Bigbusiness
Experienced member
- Messages
- 1,408
- Likes
- 23
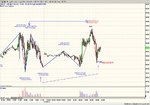
a320's charts might seem a bit elaborate at first glance but I like them. I have stuck this chart in an image editor and the two sets of red horizontal lines are copied and flipped over. The two sets of blue lines are straight copies. Personally, I find illustrated charts easier to understand than interpretations of volume.
Attachments
SOCRATES
Veteren member
- Messages
- 4,966
- Likes
- 136
Well, Bigbusiness, this is because the manner in which volume reveals itself as a market unfolds serves to confuse a lot of observers, because as I have said before, if you do not have a total understanding of it (and it is a vast subject in its own right ) you can persuade yourself to read into a chart anything you like, really. This self induced dilemma is what serves to thwart most aspirants.
Illustrated charts can be useful indeed, but only if the illustrations have any relevance.
Now what you have done there is a very creative and clever thing to do. In your unbridled sincerity, you ought to be careful of implying buy or sell suggestions however, on the basis you might be accused of giving unregulated investment advice, in good faith no doubt, which could get you in all innocence, into a lot of trouble.
Also, you ought to take note of the very valuable advice given to me by Chartman, in his post above, number 41, which I wholeheartedly now embrace, and for which I thank him, as it points out to me the dangers of the terrain you may be considering, and therefore, by default, inadvertently straying into with regard to the above. If you have any sense, you ought to avail yourself of his very good, very sound advice.
Your illustrations of tops and bottoms clearly mark them for those who are unaware of their presence, that is, have not noticed what they are, or even that they are there.
We are all very grateful to you for your contribution, and since you appear to be able to penetrate the fog of A320's ideas, perhaps you may enlighten us committed darksiders, but oblivious as to the finer points of chart decoration, as to why it might be necessary or even desirable to embellish very simple charts with very (apparently) complicated scaffolding, numbers, percentages, ratios, ciphers, and so on.
For my part I must say it is very impressive that you are able to understand it, indeed unravel it, and find it of some use.
The originator of the idea is very reluctant to elucidate his hypothesis.You are the first and only member to comment committedly with regard to this matter, which I admit, to me personally, remains an unsolved mystery, as to its purpose, intent and utility.
And a very good morning to you sir.
Last edited:
What is the point?
While I found Socrates explanation of a320's chart more enlightening than the added lines and annotations that a320 had provided that does NOT mean one is right and the other wrong. It simply means that for me, this method of explaining worked better. For Bigbusiness it seems to have been the other way round.
Let's all accept that different people need different explanations, using different approaches, of the same things.
One of the reasons that this site works well (for me anyway) is that you do get different forms of explanation of the same thing which aids enlightenment and speeds up understanding.
It would all be even better if the egos were kept in check. Perhaps someone could find an ego-checker along the lines of the profanity checker that would astrerix out (oops, have I just created a new verb?) all inflated-ego statements. I am not meaning to have a go at anyone in particular nor invite retaliation but it just gets in the way so much.
SOCRATES
Veteren member
- Messages
- 4,966
- Likes
- 136
No one is saying whether it is right or wrong. In a free society everyone is entitled to have an opinion, because that is a fundamental pillar underpinning discussion within a framework of democracy.gcb01 said:While I found Socrates explanation of a320's chart more enlightening than the added lines and annotations that a320 had provided that does NOT mean one is right and the other wrong. It simply means that for me, this method of explaining worked better. For Bigbusiness it seems to have been the other way round.
Let's all accept that different people need different explanations, using different approaches, of the same things.
One of the reasons that this site works well (for me anyway) is that you do get different forms of explanation of the same thing which aids enlightenment and speeds up understanding.
It would all be even better if the egos were kept in check. Perhaps someone could find an ego-checker along the lines of the profanity checker that would astrerix out (oops, have I just created a new verb?) all inflated-ego statements. I am not meaning to have a go at anyone in particular nor invite retaliation but it just gets in the way so much.
However an opinion is invalid if it can not stand up to detailed and crytical validation.
Here we are, discussing in a very civilised way, what might be the added benefits of cryptic scaffolding, numerology, ciphers and unexplained annotations, embellishing a chart, whose original content is simple, as I am curious as to why and for what reason all this is added and not clearly explained.
When I set to explain market action, in terms of price, time and volume, I am mindful that the great majority of members are not experts in this niche subject. Therefore, as a courtesy to them, the manner in which volume related matters is offered by way of explanation is done in as simple and clear language as possible for everybody to understand.
I do not use the definitions used by accomplished darksiders in this respect nor expressions nor language nor the terminology we use among ourselves in private because it would not be fair to do so , as it would only serve to baffle everyone and make their difficulties greater in getting to grips with this vast subject, that is already complicated enough, please.
But we are entitled to enquire as to the validity and utility of embellishments added for purposes and reasons that are not entirely clear, and are not cleared up, this is what serves to intrigue me, as I do not see the worth of it. But here must be some worth to the originator otherwise none of these charts would be persistently draped with all this cryptic scaffolding and numbers and things. Why, and what for, and for whom, and to what end ?
Despite requests to have it explained for your collective benefit (not mine) the originator of the idea refuses to elucidate his hypothesis. That is all.....Now let us see if Bigbusiness can throw some light on this matter. We respectfully await his pronouncements with interest.
Last edited:
Bigbusiness
Experienced member
- Messages
- 1,408
- Likes
- 23
SOCRATES said:Now what you have done there is a very creative and clever thing to do. In your unbridled sincerity, you ought to be careful of implying buy or sell suggestions however, on the basis you might be accused of giving unregulated investment advice, in good faith no doubt, which could get you in all innocence, into a lot of trouble.
Also, you ought to take note of the very valuable advice given to me by Chartman, in his post above, number 47, which I wholeheartedly now embrace, and for which I thank him, as it points out to me the dangers of the terrain you may be considering, and therefore, by default, inadvertently straying into with regard to the above. If you have any sense, you ought to avail yourself of his very good, very sound advice.
Post number 47 in this thread is one of yours, I am not sure of the post you are referring to. If I could get in to trouble for posting that chart, what about all the other charts posted on TTW?
Your illustrations of tops and bottoms clearly mark them for those who are unaware of their presence, that is, have not noticed what they are, or even that they are there.
We are all very grateful to you for your contribution, and since you appear to be able to penetrate the fog of A320's ideas, perhaps you may enlighten us committed darksiders, but oblivious as to the finer points of chart decoration, as to why it might be necessary or even desirable to embellish very simple charts with very (apparently) complicated scaffolding, numbers, percentages, ratios, ciphers, and so on.
For my part I must say it is very impressive that you are able to understand it, indeed unravel it, and find it of some use.
The originator of the idea is very reluctant to elucidate his hypothesis.You are the first and only member to comment committedly with regard to this matter, which I admit, to me personally, remains an unsolved mystery, as to its purpose, intent and utility.
And a very good morning to you sir.
I think a320's charting package puts most of those numbers on. If you look closely, most of them are just counting bars and changes in price. It is a method that some people seem to be successful with, so I don't see the point in knocking it. Each to their own. I have seen far more complicated charts than that. I couldn't make anything out of this but I am sure someone can 🙂 http://www.ensignsoftware.com/images/16-1.gif
The eye is excellent at spotting patterns, even when none exist but it is not so easy to spot moves of equal price when they do not have the same slope. It is also not that easy to spot the equal time and price moves, if you don't look closely. As for the ratio's, I am not an expert on that but I have seen previous posts about the theory of alternation and how these ratios can be used.
roguetrader
Senior member
- Messages
- 2,062
- Likes
- 49
Wow BB thought my charts had a lot of lines. 😆Bigbusiness said:I have seen far more complicated charts than that. I couldn't make anything out of this but I am sure someone can 🙂 http://www.ensignsoftware.com/images/16-1.gif
SOCRATES
Veteren member
- Messages
- 4,966
- Likes
- 136
Hello Bigbusiness, I meant post number 41, I am sorry. Thank you for your prompt reply.
As for getting into trouble as a topic, sincerely, you really ought not to court it, by rigidly sticking to what you can prove yourself and not as a consequence of other people's opinions. I myself have learnt of guardedly taking the precaution in advance that the proof must be in place before the pronouncement is made, and that the pronouncement however off the wall or seemingly arcane to most ordinary people on first inspection, is the unadulterated truth and based in irrefutable provable fact, even if you yourself know it to be absolutely true, you must ensure in advance that you leave yourself a correct and clear route to explain it in structured form in logical sequence that detractors have to accept whether they like it or not, as it can be subject to the most severe examination from any angle, by anybody possessed of reasoning powers and common sense. That is my experience, and I sincerely offer it to you for your benefit and protection, as my experience proves to me anything else is not secure. You have to consider your own protection, and that is my advice.
Your explanation finally and at long last reveals all, and for this, many thanks indeed.
And now let us turn our attention to our individual and collective endeavours, and let us enjoy another splendid day.
Last edited:
dc2000
Veteren member
- Messages
- 4,766
- Likes
- 129
Chartman your statement puzzles me
I would have thought that this was exactly what this thread is all about, the ability to preempt a move be it by a day or a week based on a particular knowledge or way of thinking will allow those new to trading to see how others trade and what they look for.I think you will find none of here on this thread are interested in anyone's predictions for the future.Specifically what may or may not happen tomorrow, or next week or next year, as opposed to what may or may not happen in the next few minutes on a given instrument.