Dow Intraday Charts 10-14 Jan 05

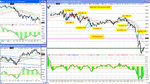
It looked like a bull flag developed during the morning and the double bottom at 64 with PD looked like a great entry. But the flag went nowhere when it broke and seemed to develop into a bear flag instead.

It was looking very overbought at 590 (19:00GMT) and that was the perfect entry for the 7pm selloff.

Its looking very oversold now so I am long overnight looking for a pullback.

Justyn.
 

Attachments

  • chart.gif
    chart.gif
    12.4 KB · Views: 193
I said last night it looked like a short term top.....With any luck this will be a bottom... not exactly rocket science.... :(
 

Attachments

  • dow 13-01-05 10.gif
    dow 13-01-05 10.gif
    42 KB · Views: 191
Not too hard to see the weakness in the bear flag from 570 to 590, which should have prompted a short... down to T1 and out at the bump PD.The bump ND and failure to make 590 again should have confirmed it.
 

Attachments

  • dow 13-01-05 1.gif
    dow 13-01-05 1.gif
    41.5 KB · Views: 188
Hi Chartman, hoping you'll excuse an off-topic question which I ask only because of all your comments about T2W members having two nicks: why is that you and the member known as Jonnyy40 can apparently muster only one profile photo between the two of you?
 
I've been struggling with my exits this month so am trying something new today using recent swing high to set stop, then putting a target of 2x stop on the trade and then sitting on my hands to see what it does...

9:45 1) S 10594.
9:45 EXIT: +12. Nice start!

9:53 2) S 10585.
9:59 EXIT: -7. Not nice when it goes wrong though.

10:47 3) S 10581.
11:07 EXIT: -8. After all that.

11:39 4) S 10579.
11:45 EXIT: +16.

11:50 5) S 10565.
11:51 EXIT: -4.

13:59 6) L 588.
14:03 EXIT: -5.

14:48 7) S 10573.
14:53 EXIT: +6.

14:57 8) S 10566.
15:18 EXIT: +10.

15:28 9) S 10534.
15:29 EXIT: +12. Sweet!

+32 from 9
+23 for the day after commissions
+42 for January so far (9 days of trading)

Not sure what to think of today. It removed much of the decision making requirements once in trades (which I have been getting wrong too much this month) but I would like to think I would have done a little better when the breakdown finally came left to my own judgement. I'll give it another try tomorrow and see.
 

Attachments

  • 20050113.jpg
    20050113.jpg
    398.3 KB · Views: 197
tRADERtONY ARE YOU USING A 100EMA ON YOUR CHART FOR THE EMINI DOW OR NOT. i MAYBE WRONG BUT i SEEN TO RECALL THAT IT WAS A 7MIN EMA. CAN YOU ADVISE.

tHANKS
 
to trader tony

Hi Tony

Nice, and systematic trading, but why aren't you taking the trends with your trades ?
For example the last 3 trades on 13-1-2005 you could make much more then +12. Try trading with multiple contracts with each trailing stops, or targets or time frame. Your losers are alright a contract! You will see that trading is try picking the trends all the way for the big moves.

Your basic set is OK :cool:

succes in trading
 
9:51 1) S 10514. No follow through at all.
9:51 EXIT: -7. Bad start.

10:02 2) L 10531. To see if it wants to go up but right below pivot and HOD so nervous.
10:04. EXIT:-7. This is horrible. Two trades that have both gone immediately into loss and exit.

10:33 3) L 10555. Missed the breakout, looking for a second push.
10:35 EXIT: +10.

11:47 4) S 10534. Has to break through pivot. And failing.
11:50 EXIT: -4.

This is not going well.

12:29 5) L 10547. This one is going.
12:30 EXIT: +8.

12:35 6) L 10554. No follow through.
12:46 EXIT: -6.

Four losers from six is too many for me - I hate it. Back to the drawing board, again, me thinks.

Well, it's 7pm and I have to quit for the week. Very frustrating day - maybe it will break again near the close. Better week but I'm not happy with my trading at the moment. I'm chopping and changing again far too much trying to regain the form of December but it's not feeling right.

-6 from 6.
-12 for the day after commissions.

Back on Tuesday to try again. Charts to follow later.

Good weekend to all.
 
Just noticed the comments above which I appreciate and will respond to later.

Orky - the red lines are 100 ema of high and lows (the greens 50 emas). Helps me see if the market is moving or not.

In other words, when the bands appear tight and green is seperated from red, market is trending. When they appear wide and inter twinned, we are flip flopping. Just a quick visual that I find helpful.
 
Last edited:
TraderTony

I'm hardly in a position to give advise but what I would say is, from my own experiences, I have learned that often, I do not stick to my trading plan for a long enough period to be able to judge its effectiveness. ie at the first sign of a bad run I try to make adjustments etc.

I'm not saying that this is the case with you however there are very good reasons that you attained a level of succes pre xmas and I'm sure that should you remain faithfull to those methods that you will be successfull again.

Either way i wish you the very best in what is both a very difficult and, at times, lonely job.

Cheers
 
If we ignore that glitch bottom, we've now got a nice healthy dose of PD
 

Attachments

  • dow 14-01-05 10.gif
    dow 14-01-05 10.gif
    40.7 KB · Views: 210
Open triangle fails to meet target....and spends the rest of the day running from 32 to 64. If only we knew that before hand....
 

Attachments

  • dow 14-01-05 1.gif
    dow 14-01-05 1.gif
    29.5 KB · Views: 232
smiley said:
TraderTony

I'm hardly in a position to give advise but what I would say is, from my own experiences, I have learned that often, I do not stick to my trading plan for a long enough period to be able to judge its effectiveness. ie at the first sign of a bad run I try to make adjustments etc.

I'm not saying that this is the case with you however there are very good reasons that you attained a level of succes pre xmas and I'm sure that should you remain faithfull to those methods that you will be successfull again.

Either way i wish you the very best in what is both a very difficult and, at times, lonely job.

Cheers

Smiley - I think you are absolutely right. I have lost touch a little and am now jumping around too rapidly - I recognise the symptoms from the past. I think tweaking is one thing but what I'm doing now has a twinge of panic about it. It will pass soon I trust.
 
x-trader said:
Hi Tony

Nice, and systematic trading, but why aren't you taking the trends with your trades ?
For example the last 3 trades on 13-1-2005 you could make much more then +12. Try trading with multiple contracts with each trailing stops, or targets or time frame. Your losers are alright a contract! You will see that trading is try picking the trends all the way for the big moves.

Your basic set is OK :cool:

succes in trading

This is something I do look at periodically but I have also realised I feel happier taking a smaller number of points more consistently that having a few big wins. However, I'm sure there is a way I could utilise trailing stops and multiple targets and will work with it.
 
not so bad

10000 whithin 6-8 weeks - next week will be ugly - a ST buy on Thu/Fri - SPX some more p on the downside 1162 something??? (1145/50 in the worst case)
ST bottom where we are now - lots of ammo in the Premium
GL
 
Last edited:
Top