You are using an out of date browser. It may not display this or other websites correctly.
You should upgrade or use an alternative browser.
You should upgrade or use an alternative browser.
tradesmart
Experienced member
- Messages
- 1,286
- Likes
- 22
Hi Gang
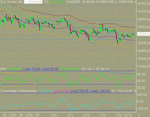
Haven’t had much time for posting lately – been too busy with a spot of property development – improvements to the Trading Shed – you’ll notice the difference immediately in the view from the ShedCam below…….
Always a timely reminder to nurture and enhance your shedload...... 😎
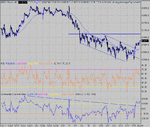
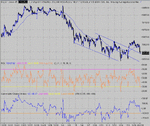
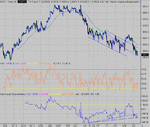
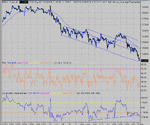
Ye of little bullish faith, will have no doubt been phased by the bears having a small cut of the action recently, but in conjunction with my alter ego, Mystic Meg, I can reveal that 11300 is still in the frame and the chart attached shows how it’s gonna get there….
The 425ish height of the major consolidation is the clue, so it’s next stop resistance at 875 and wait for the breakout…..
Geddit……?........... 😉
Attachments
Just a quick query among the dow traders here, I know people post charts of the actual index DOW, I'm interested to know which chart makes your entry and exit ...would it be the YM chart or the dow index chart itself. This is after all your analysis looking at other futuers etc , which chart do you find the most helpful in making an entry/exit and in which timeframe, 10 sec,1 min? I 'm assuming this as most trade the YM here or have I got it totally wronga dn am barking up the wrong tree altogether.
Thanks in advance
Thanks in advance
frugi
1
- Messages
- 1,843
- Likes
- 133
Hi sall,
I use the 1 min YM chart for entry and exit, with confirmation from the 5 and 60 min YM charts and a glance at the daily INDU and other main indexes. I will sometimes switch the 5 min to ES or NQ for a few seconds to see what they're up to at decision points too.
I use the 1 min YM chart for entry and exit, with confirmation from the 5 and 60 min YM charts and a glance at the daily INDU and other main indexes. I will sometimes switch the 5 min to ES or NQ for a few seconds to see what they're up to at decision points too.
karmit said:any advice for next week? long or short?
Yes Karmit. Trade what you see and not what ANYONE tells you may or may not be going to happen, including myself. It's all well and good having a go at predicting what is going to happen tomorrow/next week, but it's purely TA guesswork based on what we see today. Yesterday looked good for a move up, until the news crashed everything,
Not what you wanted to hear, but take heed of what I say. You'll never learn anything taking someone else's advice/opinion and acting on it.. That will just help you empty your bank account a bit quicker. Why? because when it doesn't go according to advice, you end up saying to yourself ' I was told it was going up, so I'd better stay in'..................
tradesmart
Experienced member
- Messages
- 1,286
- Likes
- 22
Oh well, so much for bullish thoughts of an end of week bounce to give the bears a sore head…..!........ 😆
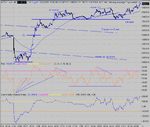
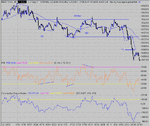
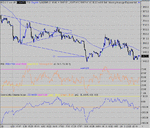
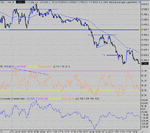
Must confess that I spent the beginning of the session looking for a long, but eventually saw the light, and went short at the triangle break at 10480, and can now afford a packet of pork scratchings to go with the evening shandy (or something..)
Research from TrimTabs has revealed that mutual fund inflows to US stocks in the first 10 days of ’05 were ZERO, and what with most hedge funds ending ‘04 at maximum leverage long in anticipation of new year gains (now forced sellers) there has been no buying power in the market (you’ve noticed that haven’t you……?!?)
And what with Warren Buffett advising US investors to put their money into international funds and the Euro…… 🙁
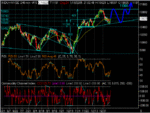
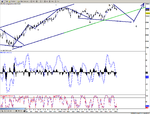
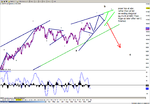
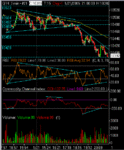
And is that a H&S showing on the 4hr chart.......?..........(but don't discount the possibility of a 'handbrake turn' with many Dow components reporting earnings next week.....one good 'spark' could ignite a 150 point rally fuelled by short covering imho.... 😉 )

