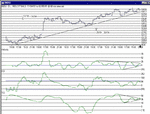
Dow tested 10920 three time again tonight and failed, and then went on to test 10864 a number of times and finished up slightly higher to close at 10876.From the attached 1hr intraday chart, I think the time has come for a major descision.We can see over the last few days, a bull triangle forming, with the top at 10920.(the top trendline across 10,920 got chopped off..) We can estimate a rise from the breakout( 10920) to be in the order of 200 points, giving us a minimum target of 11120.From further analysis on the line chart, I see a substantial inverted head and shoulders bottom, from which I estimate the potential rise to be to 11,400.
From the charts, notice the triangle formation on the TCI,CCI and Velocity indicators . These are my favourite chart patterns, especially when all four come into line. This has lead to explosive breakouts in the past on various stocks when I have seen them( MONI springs to mind).
A few days before the last rise saw a nice "Bull Flag" formation(18/04 to 24/04- general down channel trend).
As allways DYOR, or form your own opinions!

