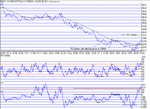
Dow Intraday charts 29/07 02/08

ChartMan

Legendary member
Messages
5,580
Likes
47
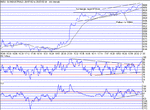
Not a lot going on today, other than a slow steady rise after the price caught up the week end futures rise.There was a bull triangle formation that made the target of 8700, but the breakout was almost inpossible to predict from TA...instead the only real clue was the price breakout, followed by a pullback and bounce from the 100MA to finally confirm the break. Up another 450 points from Friday,with a 300 point rise from the open.The tea time traders should/could have caught the triangle breakout, and gained 100 or so points staying with the price above the 100MA.
 

Attachments

  • 29-07-02.gif
    29-07-02.gif
    15.7 KB · Views: 454
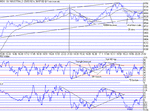
A channel is forming on the 1 min chart- 200 points wide. Today's action favoured the 100MA players very well, with clear cut breaks at two points. The first came soon after the first triangle break that signalled a bottom, later confirmed by the 100MA break at 8589. Following this up the 100MA ( assuming you had the nerve to hold through the 50 point pullback to the 100MA), we got a 3 pk ND top, confirmed by the prior RS switch.The drop to support at 8600 was then confirmed by the pd bottom, which unusually had a very short time scale of only 20 minutes. By now the fast action had moved the 100MA a long way off the action.... The secret is to take the ride to either the ND top or PD bottom , and then decide whether to switch direction with safety.Today, you would have been very successful switching at the top and bottom , but it is not always that good at working in your favour.
 

Attachments

  • 30-07-02.gif
    30-07-02.gif
    18.1 KB · Views: 436
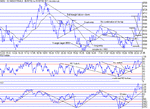
We dropped out of the 200 point channel mainly due to news, bet ended up back in channel. Great volatility again today with about 4-500 points to be had. Lots of interesting TA , as noted on the charts. Please also study the number of "events" that went in threes today, before resolving a direction change or confirmation. I've never seen so many triplets... The general overall formation can be seen as a large "W", and this should break to the upside( I hope!)
Was the fact that the top had no Negative Divergence a sign that there was iminent upside? i'e' it wasn't a top, just a strange variation of a bull flag? Note also the targets on the 5 legs up into the close.
 

Attachments

  • 31-07-02.gif
    31-07-02.gif
    20.2 KB · Views: 401
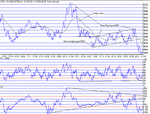
Tricky day. Only a couple of good moves to get some real points action, one at the open, one at the close. Inbetween was a hard call, what with the increase in spreads of two points by fins and CMC and the "violent" bias on fins......The bear flag that developed over most of the day gives a target of 8400...
 

Attachments

  • 01-08-02.gif
    01-08-02.gif
    18.9 KB · Views: 368
Simple day today ( for some) with a straight drop from the open all the way to the bottom at just off 8200, then a rally into the close of 100 points to close just above 8300. The PD bottom in the middle would/could have added another 70 odd points with a small penalty at the 100MA break that failed. Even so , trading the 100MA would have made a perfect day for most and collected the best part of 300 points out of the 500 on offer.
 

Attachments

  • 02-08-02.gif
    02-08-02.gif
    16.5 KB · Views: 351
Top