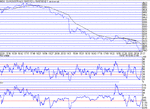
Dow Intraday charts 15/07 19/07

ChartMan

Legendary member
Messages
5,580
Likes
47
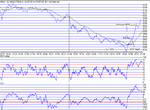
Not a lot of TA again today, save the huge points under and over the 100MA. No indication of the bottom save the rapid decline to the bottom, resulting in a "V" bottom and an Inverse H&S. Interestingly after all this turmoil, TA still performs, and the Inv. H&S pullback was to the 100MA where it bounced and took off. That entry should have given you at least 300 points.The tricky bit was the pullback of 50 points from 8600, before finally closing at 8639, down 43 on the day.
 

Attachments

  • 15-07-02.gif
    15-07-02.gif
    15.5 KB · Views: 487
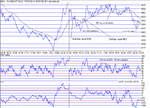
Some good TA today, starting with the bear flag, soon after the open, giving the target bottom of 8400 that wasn't quite reached. At this bottom, we got an Inv. H&S that performed by breaking the 100MA and giving the characteristic pullback close to the 100. This pullback was complex in that it formed a mini bull flag, giving a target of 8601 which was easily reached. That top dropped back to the 100MA to bounce, having failed to break substantially beyond 8616 which was the 23% Fib point. Riding up the 100 resulted in another test of 8616, but five failed attempts signalled the inevitable. From the ND top , confirmation of the drop was swift as it broke down through the 100MA, but confused by the whipsaws that followed. The final drop was swift and with a pullback to the 100 followed by 5 legs down to 8432, before recovering at the close. I wouldn't put too much emphasis on the fact that the close showed an Inv. H&S failure. Except by way of confirmation of lack of strength by the bulls to close at the 100MA. Another 600 points on offer today but calling the tops and bottoms would have been very tricky as there were no real clues.
 

Attachments

  • 16-07-02.gif
    16-07-02.gif
    18.7 KB · Views: 431
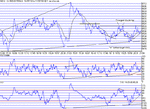
Nothing of any real significance today in the way of TA. However there is the possibility of a bull traingle developing. This would give a breakout target of 8700.....
 

Attachments

  • 17-07-02.gif
    17-07-02.gif
    18.4 KB · Views: 421
Curiousity really, Chartman; but do patterns developing at the close on a 1 minute chart complete the next day?
 
Some do, and some don.t. Some trends do, and some don't. it tends to get screwed when the overnight market makes a substantial move in one direction or the other. If we could plan the overnight moves with TA, we'd be on a winner. Sadly, it's toss a coin mostly....
 
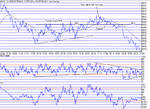
The bull triangle from yesterday tried to break out, but got hit in the end by news. The first recovered, temporarily, but finally support was lost. The retrace and bounce off the 100 MA confirmed a short entry, soon followed by a rapid drop to 8500 and a retest . The decline then continued on down into the close.That pullback to 8500 was just about the halfway point of the overall move....
 

Attachments

  • 18-07-02.gif
    18-07-02.gif
    17.3 KB · Views: 370
Nothing to shout about today, even though the drop was over 400 points. The action stayed mostly below the 100MA, bar one small excursion.....More next week...
 

Attachments

  • 19-07-02.gif
    19-07-02.gif
    14.4 KB · Views: 328
Top