Dow 07/01/02

ChartMan

Legendary member
Messages
5,580
Likes
47
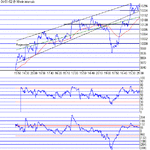
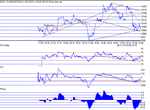
Handsome gains recently, with some strange drops- well overdone and equally well over recovered. The Major level of 10,240 will be too much to overcome at the moment, I feel....The regression(10,180) line on the 10 min chart almost coincides with the 100MA (10,176), both of which are strong indicators of future direction. TA from the last consolidation at 10,128 has not moved up with the price action and can therfore be considered as Negative Divergence,or rather non confirmation. I see the DOW retracing back to 10,128 and then recovering to the 100MA/regression . I'd like to see further consolidation , where ever it may be, between 10K and 10250, before attempting further upside. At the moment it looks weak....but there is an outside chance of support being found at 10,224, remembering the DOW is at the breakout point from the major downtrend resistance line (10,240).
 

Attachments

  • dow070102.gif
    dow070102.gif
    12 KB · Views: 449
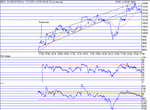
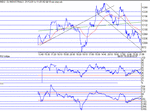
The DOW touched 300 today before finally moving down to 190. I was surprised to see it hold up for so long...and still think it will continue its early decline, on down to 128 levels to reach realistic values....Then there may be a clearer indication of direction.So far we have had a false breakout at 240, and I expect a revisit is some time away....The regression moved up to 211 and the 100MA to 207 from 180 yesterday. Phase has moved negative, confirming more downside. Wait and see what happens at 128....
 

Attachments

  • dow070102a.gif
    dow070102a.gif
    14.1 KB · Views: 436
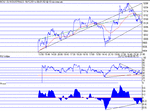
Eeeek! Spot on! A superb retrace to exactly where I thought it would go over the weekend. 3 bottoms at 135,127 and 124. Now showing signs of Positive Divergence which may lead to a breakout from the current triangle, bottom at 9936, top at 10'290 apex at 10,128. This could lead onto a substantial break above 300....The steep downtrend from the top has just about broken to the upside, but needs confirmation by further up movement and at the least, a holding of 10,128, the latter seems reasonable given the PD. The original up trend from the 18th is well and truly broken, with a newer parallel uptrend support line just formed.This will be regarded as a "correction" if it continues to provide support.
The regression line has moved down a few points to 10,206 and the 100MA is at 10,178- both suggesting some up-side.
The last 6 days have been relatively volatile with excessive movements in both directions- expect more of the same for now.
Support 10,128;10,096;10,064,10K
Resistance 10,190;10,216; 10,290
 

Attachments

  • dow080102.gif
    dow080102.gif
    13.3 KB · Views: 411
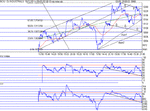
Well, we got the breakout, we got the volatilility and more- all over the place.:) Opened straight up to 10,270, a bit of dithering for lunch, quick test of support at 196 and then a major tank to 76, closing at 10,093, a shade below support. We're at 38% retrace from the recent low to high, and no clues for direction. The triangle breakout didn't continue,the recent suggestion of a correction uptrend (slope1)is now a non starter, but it could continue with slope2. An alternative option is a new downtrend channel (arrowed), supported by TA down trend lines, and confirmed by lower lows on phase.
Regression at 10,214, 100MA at 191, both up on yesterday! This suggests that the drop was too much too quick, so I see some upside tomorrow...100 points away from the 100MA is about as far as it would usually go....Bad news etc. would lead on to further losses so look out for 9980, but being the eternal optimist, it seems unlikely. Such violent swings in mood make TA very difficult, so seeking out my favourite divergences becomes almost impossible at the end of the trading day. All you can do is hedge and work with very tight stops. Getting it right over the last few days has been very profitable. Get it wrong without stops and you will be stung- very hard.
So, up tomorrow and a retest of 240? Another failed test here and the whole breakout possibility above 240 will be gone for some while.......
 

Attachments

  • dow090102.gif
    dow090102.gif
    15.7 KB · Views: 371
Strange day today. No upside at all, as I had thought last night..... Volatility has completely gone and must rate as one of the most boring days....A slow ( relatively) drop to test 10,036 three times, and a gentle swoosh up to 100, finally dropping back to close at 67. It seems multiple tests around 10,064 were performed, finding both support and resistance.Prior support at 10,096 was tested twice and failed. Given the close position, it's impossible to say if the closing value is going to push through resistance of 10,064 tomorrow. I suppose it's good that the DOW didn't test 10k....On a more positive note, there has been gentle positive divergence all day, giving hope for upside tomorrow, confirmed by Phase trend line rising all day from the first dip to 36.
Still very weak, and no real sign of big moves either way.
Regression moved down to 10,183 and 100MA down to 10,119. A number of possibilities are developing. For example, there could be a major bull triangle forming...equally plausible is a sustained down trend channel. Time will tell where we're going.
 

Attachments

  • dow100102.gif
    dow100102.gif
    13.4 KB · Views: 364
I don't follow the Dow but the S&P.
Today's boring trend was predicted but as today was a hook day then we should get a strongly trending day Friday especially as PPI figure are due and Greenspan speaks at 6.45pm.

Which way?
The attached day chart for spoos futures suggest if we don't go up, then the recent uptrend line will be broken. CCI is overbought (see red exclamation marks at bottom of main chart) which suggests down.
 

Attachments

  • test1.gif
    test1.gif
    27.7 KB · Views: 365
Well, we went up....fo 5 minutes to test 100 again, briefly, and the rest was a toboggan run. A bit of a fiddle around 28 , and then down like the Titanic,to lose 10K . There is still little in the way of confirmation,so still giving a glimmer of hope for upside.Looking at the EOD charts, the long term uptrend support line has been broken (10,060) on a closing basis,so realistically there can only be more downside to come.Take an open mind on it. The horizontal support is at 9972, with further support at 9893 and 9754. It only looks good for the bears.....and I don't mean the beenies :)
Regression at 10152 and 100MA at 10,078 with downtrend support line at 9956....
 

Attachments

  • dow110102.gif
    dow110102.gif
    13.8 KB · Views: 316
Top