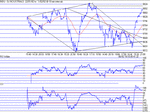
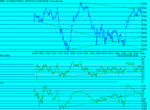
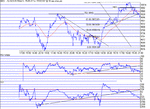
Well what a good day.No pullback on the open( well a dip...) and a nice steady rise all the way up to close, just dropping a few points from HOD to close down 3 points at 9889, up 144 on the day.The latter part of the day started to show evidence of the trend slopes changing towards "flat" but the last hour pushed up again, moving away from the flat...Overall strength on the day seemed weak- resulting in a steady rather than spectacular rise.CCI managed only a couple of small excursions into the 100+ region with RSI barely touching 70...Seems to me a good solid stable consolidation move up, with a hint of Negative divergence on the last two highs at the close.More of a tail off in positions I think, as opposed to loss of overall strength. The 1 min chart bounced up nicely all the way along the 100 MA. This in itself shows strength as usually as the DOW gets to the 100MA ( from whatever direction) and any sign of weakness results in nasty whipsaws of +/- 20 points, until the direction battle is resolved.
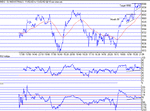
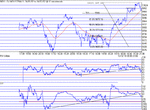
Moving on to tomorrow, take a look at the inner regular triangle.From the mouth width, we get a breakout value of 9693 + 331 = 10,024.This takes us above the last peak of 9924. Recall my recent postings about support/resistance values being at X32/X64.....Today, 9800 provided a tough nut to crack, as did 9827/38 (X32) and 9848/62 (X64) before trying to make 9900 which it never quite did. The trend line is roughly parallel with the 100MA line, watch for when the 100MA starts to flatten off, signalling weakness. So head on the block...- time for a pullback 9850 or so? and then up to try 10K....on the basis that the 15 min chart looks even stronger than 10 min chart.
100MA: 9765. Support: 9860,9828,9800. Resistance: 9910, 9932 9964 and 10K+

