The DOW This Week...11/02....15/02

ChartMan

Legendary member
Messages
5,580
Likes
47
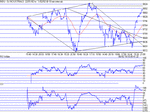
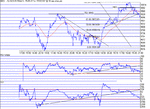
Well what a good day.No pullback on the open( well a dip...) and a nice steady rise all the way up to close, just dropping a few points from HOD to close down 3 points at 9889, up 144 on the day.The latter part of the day started to show evidence of the trend slopes changing towards "flat" but the last hour pushed up again, moving away from the flat...Overall strength on the day seemed weak- resulting in a steady rather than spectacular rise.CCI managed only a couple of small excursions into the 100+ region with RSI barely touching 70...Seems to me a good solid stable consolidation move up, with a hint of Negative divergence on the last two highs at the close.More of a tail off in positions I think, as opposed to loss of overall strength. The 1 min chart bounced up nicely all the way along the 100 MA. This in itself shows strength as usually as the DOW gets to the 100MA ( from whatever direction) and any sign of weakness results in nasty whipsaws of +/- 20 points, until the direction battle is resolved.
Moving on to tomorrow, take a look at the inner regular triangle.From the mouth width, we get a breakout value of 9693 + 331 = 10,024.This takes us above the last peak of 9924. Recall my recent postings about support/resistance values being at X32/X64.....Today, 9800 provided a tough nut to crack, as did 9827/38 (X32) and 9848/62 (X64) before trying to make 9900 which it never quite did. The trend line is roughly parallel with the 100MA line, watch for when the 100MA starts to flatten off, signalling weakness. So head on the block...- time for a pullback 9850 or so? and then up to try 10K....on the basis that the 15 min chart looks even stronger than 10 min chart.
100MA: 9765. Support: 9860,9828,9800. Resistance: 9910, 9932 9964 and 10K+
 

Attachments

  • dow110202.gif
    dow110202.gif
    15.6 KB · Views: 574
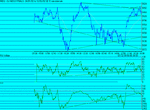
Just a brief update as I got distracted last night..After a big drop at the open,( more than I thoght) things started to look better....but after two attempts at 9900, things looked distinctly weak, closing at 9836, down 50 on the day. Right after the first attempt at 9990, TA went into Negative Divergence, signalling the end of the rise. Although the second peak at 9900 was above the first, I cant see this turning into an up channel of 80 or so points. TA on 10 min is weak, so I can't see much upside here. The 100 MA is also starting to bend over....See my daily dow report for an insight on Fib. retracements and how they are relevant to the DOW...
100 MA : 9818. Support : 9864,9850,9828,9800,9732. Resistance: 9864,9900, 10K.
 

Attachments

  • 110202.gif
    110202.gif
    16.5 KB · Views: 520
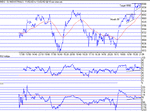
So much for not forming an up channel- It turned out to be a nice bull wedge and I missed that. That gave a clue for today's top at 9990.. :( Straight up from the off to test 10k and a quick double top. It looked all over as a solid down channel formed. But then came the bounce off 38% retrace.Confirmation of better things to come....Up to test 10K again, then a drop to bounce of 76%...and two more attempts at 10K , closing just a few points off at 9988. Note the support and resistance near 9932 and 64. The target for the triangle breakout mentioned Monday is just about met-(10,024) actually 9996- close enough. There is now another minor triangle coming into play, giving a target of 10,065. TA indicators don't show anything to support a rally failure,so there is no reason to think the DOW won't make 10,064 tomorrow. TA permitting :)
100 MA : 9901. Support : 9964,9932,9900,9864. Resistance : 9990, 10K, 10,032,10,064....
 

Attachments

  • dow130202.gif
    dow130202.gif
    14.5 KB · Views: 505
Help

Guys I have been out of trading for almost 3 months. Now that I am intent on getting back into it, I am keen to find a website or other data provider where I can access the FTSE and the DOW live or even say 1min ticks, on on which I can draw trends etc.
I apologise if this post has interrupted your flow and thanks for any help in advance
 
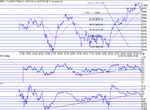
Nice. Got the triangle breakout, but didn't quite make the home base of 064- still 051 is not too far off. A quick drop down to the uptrend support at 9962 and we were off. RSI CCI making 76 and 250 on 1 min chart, helping the rise to 10,036. This was followed by a short breather before moving on. Unfortunately, it never regained it's earlier strength...testing a double top at 050 and failing with confirmed negative divergence.Then a nice drop to a bounce off support at 9960, with a flurry of activity to the end, to close at 10,002. 10K looks to be a resistance, but the 1 min chart closed strong,with RSI CCI at 64/45. 10 min chart looks weak with phase running into negative territory for the first time since the 8th....Difficult call for tomorrow. I'd like to think up...the 10 min showing signs of a recovery, but RSI is off the mark...It may just be that the broken TA uptrend lines are now going to be resistance....There's a possible H&S forming with the right shoulder at 10K... if this goes, the drop will be to 9940- which is the 23% retrace point.A bounce off there would be cool, and go some way to giving more upside.Given the fib retracements fit pretty well,it could be that we have seen the best for a while.Long entry has to be above 10,024 and short below 9940... the 100MA is sitting at 9962, just below my fav. support of 64- that being good horizontal support too.Failure there will also mean more downside....and freefall to 9900.
100MA : 9962. Support : 9992,9960,9940,9900. Resistance 10K 10,050...
 

Attachments

  • dow140202.gif
    dow140202.gif
    15.6 KB · Views: 473
And so it was...10,024 never even looked close.The up-trend TA break to the downside last night never recovered and went into freefall for the rest of the day. The H&S came good,with a drop to 76% followed by a weak re-test of 10K. The rest was downhill to the close, with a small turnround at the close to finish just over 9900.The loss of 9940 support turned out to be crucial, being horizontal support,up-trend support and the fib 76% retrace. No chance of a recovery from here , I think. Next major support point will be the 50% retrace to circa 9800. Interesting that the 100MA rolled over at 9964.....
Just in passing, I think we can say , for the record, that the Diamond formation definitely was a bull formation, having made a significantly higher high (9940 to 10,050).That's now two breaks to the upside. The last few days has shown some excellent TA examples that have been text book- two bull wedges and an H&S top.Fibonaci retracements continue to be worth their weight....in gold...well cash then.
Some of today's weeknes may be attributed to the long weekend in the USA, Monday being a holiday.No predictions short term, but I don't think I'd want to be long.The current formation is now complete, and we'll have to wait and see how things pan out next week and see what formations may begin to emerge.
100MA : 9950. Support : 9896,9864,9832,9800. Resistance : 9932,9964 and 10K.
Don't foget the Fib points as well which are close to these support values.
 

Attachments

  • dow150202.gif
    dow150202.gif
    16.4 KB · Views: 457
Hi Chartman
Just want to say thanks for all your posts on the DOW. I don't trade it yet. However by watching your posts I am learning and getting a feel for the DOW.

Many thanks
Greg
 
The Dow is a lousy index....

The Dow has so many conflicting components from diverse industrial and technology groups, that it mades for a really lousy index....but the whole world chooses to focus on it. The OEX is actually a better one to follow, vs. the Nasdaq 100 (NDX) which is dominated by 4 tech stocks like MSFT and INTC.

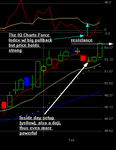
The defense contractors are doing great, the one truly and consistently strong group, with compnonents like LMT, or NOC (Lockeed Martin and Northrup Grumand). I took a snap-shot last week (below) of the buy trigger on LMT (long trigger was at 53.51....it closed today at 55.70....in three [3] trading days).

I have some other charts posted here: http://clubs.yahoo.com/clubs/stealthmarketmakers and others at: http://stockcharts.com/def/servlet/Favorites.CServlet?obj=ID48080 (navigation is from "Public Chart Lists" then to Trending Power Plays.
 

Attachments

  • lmt feb 20.gif
    lmt feb 20.gif
    7.7 KB · Views: 368
Top