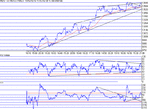
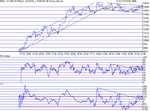
Just a quick report tonight- sorry.A lot of time spent dilly dallying around the 100MA today before finally hitting the go button around 7 to hit 650 again.Phase getting weaker,bear triangle forming, not looking good.Crunch for tomorrow 585. bounce and up, fail and down. Price still not tanking on weakness though, so a mixed bag.....
You are using an out of date browser. It may not display this or other websites correctly.
You should upgrade or use an alternative browser.
You should upgrade or use an alternative browser.
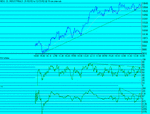
Interesting developments...Uptrend support held..and a nice bull triangle forming with a target of 130 points from breakout which would be 770 target... if it goes. The price and 100 MA have joined forces, adding to strength at 10,585. Yesterdays little effort has produce a change in the slope of RSI trend leading to upward pressure. Yesterday's drop was an "over doo" but bought us back to reality, and closer to the main uptrend.In fact it bounced perfectly off the rising support at 528 area.The rest of the day was spent on an increased slope line, which will hopefully move us up to 750 area. I'm still impressed by the failure to drop on weakness, that being borne out by a confirmed bull wedge breakout, even though CCI was at -40! Even at RSI 30 CCI - 90 the dow hardly dropped- I would have expected a tank with those values. So up tomorrow ?
100 MA 10,581. Support: 10,624, 10,600,10,568, 10,500. Resistance: 10,640-660; 10,700,10,770...
100 MA 10,581. Support: 10,624, 10,600,10,568, 10,500. Resistance: 10,640-660; 10,700,10,770...
Attachments
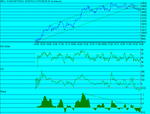
Well the bears got it. The triangle and Phase mentioned on Monday came into full effect today.Straight from the open we dropped below uptrend support, signalling things to come. A long slippery slope downwards bottoming out finally at 475, rising to close at 501. Down channel now formed 60 points wide with no real signs of anything but down. On todays chart I have shown PHASE which is a good clear trend indicator. Note the lower highs since 4th March, just before the first 600 top....A break of 516 is needed if we are to go back up...
100MA: 10,548. Support: 10,470/466; 10,328. Resistance: 10,516,10,550/64,10,600..
100MA: 10,548. Support: 10,470/466; 10,328. Resistance: 10,516,10,550/64,10,600..
Attachments
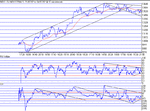
well now. Is that gonig to be just a minor correction/consolidation? I think it might just be. I said yesterday that to break the downtrend we needed 516 and today's close was 517.A quick drop to test 475 made a double bottom, with a generally boring up day, again, hard to trade...with no clear cut breaks of any size. The turning point came around 7:30 with a quick double bottom forming a nice upternd, from which we bounced just before the close.Three top tests of 550 will make that the target for a breakout tomorrow. Much was said about NR7 and 19 by Skim in the chat room tonight, and if that's true, we can expect some decent action soon. The last few Friday's trading has been excellent.....so will tomorrow be the day? Most TA signals are forming bull triangles, so I'll side on the breakout...If it does, top line resistance is 616. CCI downtrend line switched from resistance to support on the 8th. and yesterday was a pivot, turning from downtrend to uptrend support.
100MA :10,534. Support: 508/500,475. Resistance: 525,544,564 612.
100MA :10,534. Support: 508/500,475. Resistance: 525,544,564 612.
Attachments
Spot on from yesterday's call. Just didn't quite make 616, but on re-checking today,on a bigger timescale, I made it 604, and Skim had got 602 so we had to be right.🙂 Downtrends in TA clearly switched from resistance to support and although there is a small doubt in my mind about some ND on Phase (10 min), there are more bull triangles forming. Plenty of volatility today with a nice 85 points rise early on. The day closed at HOD 607 and my feeling is that Monday will continue on up. What started out loking like a rounded top, is now looking like a rounded bottom - maybe even cup and handle.Either way the main formation here seems to be Bull flag. That gives a target of 11,400- surely a long way off ? The best short term, as I remember, is the 750 mark. To the down side, today has formed a rising bear wedge,so the 600 would be the last top, before tanking, so be careful.Uptrend support is at 10,580.....On balance, the close at HOD shows strength, so lets hope this bear fails.
100 MA: 10,558. Support: 10,600;564;556;500. Resistance: 10,640/660;700;770.
100 MA: 10,558. Support: 10,600;564;556;500. Resistance: 10,640/660;700;770.
Attachments
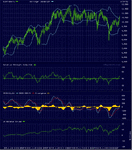
Bollinger Bands - weekly - 3 yr chart
Hi Chartman ,
I always enjoy your comments - amazing how often you get it right. However, I saw something on Bloomberg earlier in the week - on their technical analysis spot at 10:30'ish everyday. Basically, the chap they'd brought in showed a 3 year weekly chart with Bollinger Bands. The last 3 times the DOW touched or slightly broke through the upper Bollinger Bands, it didn't continue with the rally but tanked several hundred points. This week, the DOW has again touched the upper Bollinger Bands. So could that support the "rising bear wedge" you mentioned and technically increase the likelyhood of the DOW tanking as opposed to moving all the way up to 11,400?
BTW, fyi, the chap also mentioned he looked at astrology as well as part of his analysis and felt that this could be the highest the DOW gets for this year. Quite a bold supposition I thought - and on national television!
Would it be possible for you to comment on the above points?
Many thanks and regards
part 2
Here's an image of the graph I was talking about. However, an interesting point is that in the previous year, the long-term bull rally tracked the bollinger band for a substantial period of time. My view is that wont happen this time, but would be very intersted in anybody else's point of view as well.
Here's an image of the graph I was talking about. However, an interesting point is that in the previous year, the long-term bull rally tracked the bollinger band for a substantial period of time. My view is that wont happen this time, but would be very intersted in anybody else's point of view as well.
Attachments
Last edited:
Interesting. Reminds me of Glen Hoddles announcement about his use of a faith healer for the England Football Team.....I can't see what bearing the stars have on the dow, any more than a full moon brings out the Werewolves 🙂 As for the Bolly bands, Skim is the one to analyse those- perhaps she will give her opinion. Mine is that a touch from outside the band is just a warning. Only after a slide up the band and a subsequent break to the upside would signal an end.....I'v never bee keen to "predict" any movements,although I do like to hedge my bets sometimes and call an up day with a potential target. Saying "this is as far as it goes this year" is blind stupidity, as would be saying it's on its way down to 9000. It's hard enough calling what may happen the next day. I have to say, though, that I get a great sense of satisfaction when a plan comes together and I'm sure Skim does too. Yesterday's dow has given conflicting pictures- a short term Bear triangle contained within a longer term Bull flag. Which will win? I have no idea. Only years of experience and historic reference will enable a better "guess"....Thanks for your comments, they are much appreciated.
Thanks for your reply chartman.
I take your point about the glen hoddles story etc... Personally, I don't use astrology, and don't plan to niether. However, from what little historical research I've done, something that stands out is the track record of an old wall street trader called W.D.Gann, who lived in the earlier part of the last century. Apparently, he used astrology in his geometry based technical analysis. I can understand scepticism about astronomy, but then this guys track record backs up the contrarian view. anyway, thats just by-the-by.
However, I was wondering if you could tell me how I can make contact with Skim as I'd like to follow up the Bollinger bands points. Is there some sort of t2win directory i should refer to.
Anyway, many thanks for your comments - in fact it 's me who should be appreciative.
Naz
Experienced member
- Messages
- 1,391
- Likes
- 25
When i look at the general direction of the US markets,i wont look at say one index but say three.The Nasdaq,Dow and S&P.They dont always work in harmony,but very often you will get some kind of divergence by one being extremely strong so that the other two turn around and follow it.
Right now the Nasdaq feels weak against the Dow and S&P.I feel that if there is any indecision in the Dow or S&P shortly then they will travel in the direction of least resistance which may well be downwards helped by the Nasdaq.
However if the Dow and S&P show unusual strength then this will grab the Nasdaq by the coat tails and take it with them.
Last edited:
- Messages
- 2,325
- Likes
- 17
hi dsmodi
I do use Bollinger Bands quite a lot, and like using them. However, I use them mainly on 1 and 5 minute intraday charts although the principles of using them apply in all timeframes.
As you can see from you chart, the Bollinger Bands (BBs) are 'poking' through the top BB, and therefore they are highly likely to now reverse and go to the lower BB. You can see this happening previously.
Just imagine that the BBs are elastic bands, and so once the price bars stick out one side, they will 'twang' back and the objective is for them to stick out of the other side. That's the principle in a nutshell, although there are obviously nuances as there are with reading all indicators. And of course you would not use BBs by themselves, but team them up with other indicators to give you a better all-round picture of likely direction.
So, on that basis, it does look as if the trend from here on will be down.
If you are interested in knowing more about Bollinger Bands, I suggest you take a look at John Bollinger's own website: www.bollingerbands.com
Dsmodi: "The last 3 times the DOW touched or slightly broke through the upper Bollinger Bands, it didn't continue with the rally but tanked several hundred points."
May I add here that it's not only about price touching one of the bands, among many other things (patterns, tops, bottoms, momentum, sentiment, etc) it's also about the trend of the BBs and therefore the way the BBs trend when the price hits one of the bands should be taking into consideration when working out a reversal....because price can still go up when hitting or pierceing the upper band or go down when hitting or piercing the lower one...
Another point that I picked from your chart is that price closes outside the band, this usually refers to the continuation of the direction and not reversal...
Overall, one should interpret BBs in a dynamic way and with many other facotrs and not only simply as the indicator telling buy or sell when price hits one of the bands...
Riz
johnhulton
Newbie
- Messages
- 1
- Likes
- 0
I'm not into all the technical analysis. All I know is that Fridays momentum on the Dow usually carries over into Monday. The Dow was up 90 points on Friday and I expect a similar rise or more tommorow. If this does not happen start shorting for the rest of the week. I expect the Dow to smash through 11,000 before Easter.
Naz
Experienced member
- Messages
- 1,391
- Likes
- 25
This is a time on the US indicies to trade what you see and not what you think.I think any trader at this time only has a 50% chance of getting it correct.This is mainly because i trade the Nasdaq and there is a massive two day island sitting at the top of the chart.Islands on the Nasdaq tend to work.Indeed the bottom at 1400 was made by an island.So i would say if you trade the Dow or the S&P and you're realy bullish just keep an eye on the Nasdaq and make sure it goes with you.
thnanks 2 all
Thanks to Chartman/Skimbleshanks/naz/riz/johnhulton for all your replies. It was really good logging on and getting an email and seeing people noticing something posted by me (albeit what I posted was something mentioned by Tom Hoougard, of Financial Spreads, on bloomberg).
I think this week (commencing 18 march) will be quite important. If there is a clear break of last weeks highs, then I'm a bull. But below last weeks lows [and I think thats what will happen] then I'm a bear. I think the Bollinger Bands will work, and DOW will retrace having gone up approx 1000 points in less than a month.
After a retrace, the next move up should be towards 11K.
Anyway, all input was appreciated.

