The DOW this week 29/04 - 03/05

ChartMan

Legendary member
Messages
5,580
Likes
47
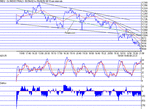
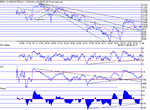
Still down , down, down. Talking in the chat room tonight, we discussed the usual bottom finding by the 3/4 slope change intraday and whether this may apply to finding the bottom on the 10 min chart. As I see it, there are 4/5 slope changes here, but with no feeling of a bottom in sight....
From the off, once again there was a glimmer of hope in the Inverse H&S but it failed to perform- getting stuck three times testing 9932. From the final test it was all hands to the pump as it sunk to 9820, where it just simply stuck for the last 20 mins. or so.Just for a change I have shown tonight's chart with ADX/R and DIR- this shows just how much down force there is.
Some people say we're going to test Sept lows.... I personally can't see that, but 9700/9600 is certainly on the cards...From the EOD charts, nearest support is around 9650.
100MA: 9940. Support: 9750,9600. Resistance:9850,9864,9884,9900.
 

Attachments

  • dow290402.gif
    dow290402.gif
    16.1 KB · Views: 517
We've become scared of establishing support levels lol, as Dow keeps breaking down...but daily chart gets congested from 9800 down, 650 as you say and the next and strongest one being 9600...I dont think we're going to retest Sep lows though...in the mean time so long as we dont see a strong bounce to break and hold above 890-00 the trend is down...depressing isnt it, fed up with seeing red candles day in day out lol...

Riz
 
Believe in the Force, Obiwan :( The 4/5 slope change got it bang on the nail. A surprise to us all, I believe. Just when there seemed to be no hope of up, It performs big time.
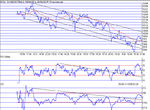
A shakey start and then a rapid rise to resistance at 9937, yesterdays "brick wall". It would take something special to get through that....but, eventually it did, helped on its way by the pushing up of the 100MA.It went soon enough following a bull flag that (almost) performed to perfection, falling just short of its target of 10,010 at 10,004. That in itself formed a rolling top with 4 pk ND, finally falling through the 100MA for confirmation at 9991.That led to a bounce at natural resistance 64 and a retest of 10K before finally dropping back to the brick wall 32 and bouncing to close at 46, up 126 on the day. Note the support/resistance and regression lines...closing at 46 is right on support...and maybe a switch back to support on that downtrend line...
100 MA:9952 Support: 9932,9900,9884. Resistance: 9950,9964,10k, 10,032......
 

Attachments

  • dow300402.gif
    dow300402.gif
    16.6 KB · Views: 474
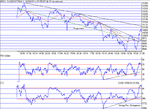
Another good trading range day. Pity the downtrend support line mentioned yesterday didn't hold ...Up to 64 and then a big drop of 130 or so points to 9836 and the potential bottomless pit ... But a quick rise off the bottom to 78 and a re-test at 32 with a dash of positive divergence, and things were looking rosy again. Just how rosy probably surprised most. If you caught the PD bottom there was an enormous rise to slice straight through 10k with a brief pause and retest as support- as if to say "are we really there already"?. Then relentlessly on to 10,083 before finally gasping "enough" and dropping back to the 100MA , to finally close at 10,055. Just about the whole of that move could have been taken in one move, with careful examination of the TA- especially the bull flags and the ND top- see the TA section for more detail. So if you cant work it out, that was 135 down and 250 up - 385 in all.
100MA: 9960. Support: 10,032, 10K,9964,9932. Resistance:10,083,164,232....
 

Attachments

  • dow010502.gif
    dow010502.gif
    17 KB · Views: 463
A truly boring day, being totally range bound within 50 points.Price has moved 150 points above regression line which is heading towards max. Consolidation before a breakout? Pullback to 10K? It's just possible that today has formed a bull flag...and that would give a target of around 300.....
100MA: 10,024. Support:10,050,032,10K. Resistance: 10,100,132,164,264...
 

Attachments

  • dow020502.gif
    dow020502.gif
    18.1 KB · Views: 378
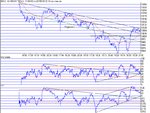
Regression won the day....the prospect of a continued rise was short lived- the drop to 59 and meagre pullback to 77 signalled the drop to to 9973 and the "W" formation for a rapid rise up to 10,019 - and you could be fogiven for thinking that 10K was safe. No chance! RSI at 57 and CCI at - 83, there just wasn't the strength to maintain 10k. So it slipped slowly slown down, finally breaking just after 17:00 to bottom out at 9945. A small rally to follow and a re-test of the bottom was followed by probably the best long of the day...some 70 odd points, touching 10,021.The closing action was not as stong as we have seen on some Fridays, but then it was not so bad in the end, moving down 15 points off the top, but down on the day some 85 points....Overall, room for movement to the upside, with the price now only 60 points away from regression and sitting spot on the 100MA...
100MA: 10,006. Support: 10k, 9984,9950. Resistance:10,020, 050,100.
 

Attachments

  • dow030502.gif
    dow030502.gif
    16.5 KB · Views: 363
Top