The dow This week 04/03-08/03

ChartMan

Legendary member
Messages
5,580
Likes
47
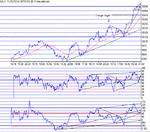
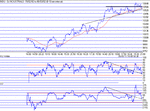
Not much to say today.....straight up to test 500 and finding comfortable support, followed by a steady lunch time drift up to 550. That was followed by a drift back down to test 500 again and form a nice double bottom. From there it was off to test 600, making a high of 599.5 . Plenty of strength in RSI and CCI to help sustain this rally. Downside is too much too quick today, although you wouldn't have thought it daytrading, leaving very few clear cut calls. Price is too far away from the 100 MA as well- just on 200 points,but that had reduced from 250 earlier in the day. Tomorrow may see a pullback /correction to 550 or even 500 and off again...
EOD uptrend resistance at 10,620 ish...then 750.
Second major slope change....Interesting middle line through TA indicating SR switching in and out on the way up, closing today under support on CCI and just over on RSI.

100 MA : 10392. Support: 550,500,428. Resistance: 600
 

Attachments

  • dow040302.gif
    dow040302.gif
    14.5 KB · Views: 513
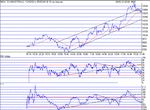
And so we returned to the 100MA...It was inevitable I guess having spent so much time such a long way above it. The Mid line through TA shown yesterday proved descisive, the support line switching to resistance clearly seen in effect today. My only surprise today was the extent of the drop- right back to the 100MA. The rush to test 600 again was short lived,dropping rapidy to test 468 four times, the last one failing and turning that point into resistance, to finally closeat 10,433, 10 points off the bottom.
The uptrend breakout failure can be seen cofirmed as the dow tried to bouce off it at 464 to 493, finally losing it there. Is this a movement back into the up channel, leading to lows around 350, or will it turn out to be a false alarm and return to resume above the uptrend support line?. 23% retrace from the 9700 lows is 10,393.
100MA : 10,441. Support: 10,422,10,300,10,250,10,232. Resistance: 10,464,10,500,10,520,10,550.
 

Attachments

  • dow050302.gif
    dow050302.gif
    15.1 KB · Views: 476
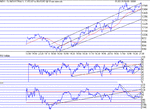
Virtually a perfect bounce of yesterday's close on the 100MA.A good day's gains, tracking the 100 MA all the way, never deviating too far, or dropping below by much. 500 was blown away and after 4 tests of 550, 600 finally became the top for the day.This was preceded by a 4 peak negative divergent top, signalling the end, the final sell off closing just 1 point above the 100MA (1 min). Although things look good for another test of 600, Phase is Neg Divergent on 10 min chart,as is RSI, meaning almost certainly some down tomorrow. That's no bad thing, having gone up for far too long, even though it's not been too quick.We need a retrace to consolidate and so my guess is we'll see that very shortly.Regression line from the 9700 bottom is at 10,572 ( 1 min 100MA) Pehaps abounce of the 100MA again...
100MA: 10,496. Support: 10,566,10,532,10,513,10,500. Resistance: 10,600, 10,750.
 

Attachments

  • dow060302.gif
    dow060302.gif
    14.7 KB · Views: 441
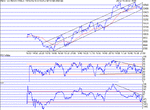
Well, we got the pull back...a tad further than I thought but there we are...It has bounced on the uptrend support and finished strongly today.TA is broadly in line with the price so I 'm thinking of upside again tomorrow. Trading was hard today for bulls, The bears having all the fun.Strong support at 480 just about held up towards the end of the day, LOD being at 471. At this point there was a confirmed 4 point Pos. Divergence signalling the end of the down trend. Before that we had a 3 slope change on the down trends,signalling a "close to the bottom". (see TA section on the bb). There's a substantial double top at 600 now and the mid line trend sits firmly at 600 too. This is looking like a tough nut to crack, 600 being the best to hope for. At that point it will be major descision time- onwards and upwards, or a major retrace/pullback. I guess confirmation of up will come with a trend break in the 10 min RSI/CCI down trend line, but beware the Bear triangle forming on RSI 10 min...

100MA: 10,504. Support: 10,500,10,480,10,432. Resistance: 10,532,10,572, 10,600.
 

Attachments

  • dow070302.gif
    dow070302.gif
    14.8 KB · Views: 422
So , upside it was. The open just flew, Futures being up about 100 pts just before the open.straight up 150 points to 657, followed by the regulatory drop to 600.Then another rapid rise to 660 for HOD and all that within the first hour.That, unfortunately was that for the rest of the day. A Bear wedge developed over time, finally exiting at the fith test of support at 591 and LOD'ing at the target of 537. The close finished on a stronger note,up 47 on the day at 10,572, having bounced off uptrend support. I can't see an end to this....finishing close to the 100MA yet again showing market acceptance. Yesterday I said that the closing downtrends on RSI and CCI had to be broken to carry on the rally , and the same is true for Monday. There is a new Support line developed now- it was a resistance line up to the end of February. TA shows that a switch from resistance to support is a sign of strength...So whilst there is a substantial decline in phase, there is undisputable strength still. RSI and CCI also show a resistance to support switch. The bull triangle formed at the top broke out today, but returned to the uptrend- a false breakout. If strength is there, I have a revised target up from 750 to 800 .To achieve that, we would almost certainly have to break the triangle again on Monday. On balance, that seems more likely. If not, we will be at the apex and certain failure...and a return to 400.
100 MA : 10,557. Support: 10,532,10,500,10,450. Resistance: 10,590,10,650,10,750.
 

Attachments

  • dow080302.gif
    dow080302.gif
    13.3 KB · Views: 390
Top