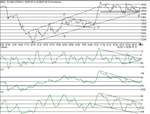
Well I got that one wrong. Firstly, I thought the candlestick for yesterday was a Hanging man- should have checked first 🙁 The big rise on open was a shock- was that due to US news? Oh well. It's nice to see the uptrend continuing and moving well away from the 464 pivotal support.It came close to the rising trend and bouced off twice and is now establishing a trading range of 515-595 with four tests at 600 . Look at the arrows on the chart. Can these two groups of three be a bull wedge/triangle. Certainly the first one performed correctly, leading to a 150 pt breakout. (The main feature was the continuation pennant).Granted it appears we are in a trading range of 515-595 but look at the last group of arrows..Is that another bull triangle?the last arrow denotes the potential breakout...It hasnt happened yet.IF it does, the target is +200 pts or 10,800. It's not so much a triangle, but DOES have the same fit and form as the previous breakout.albeit without the distinct pennant.
I have 10,792 as an EOD support/resistance value, so that correlates.....Nearest resistance , apart from the magic 600 is 625 then 672.
Velocity plot has a triangle formation with a possible breakout, and CCI has boken the downtrend slope adding weight to the possibility.Perhaps we will get a breakout tomorrow and hit 800. There have been several strong moves recently in the 150-200 point range ,so it's not impossible.

