The dow This week 18/03-22/03

ChartMan

Legendary member
Messages
5,580
Likes
47
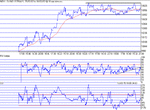
Well, it's a moot point whether the Bear Flag on Friday worked. If it did, it was late.... A quick rise to test 660 again and then most of the day was spent looking for a bottom.It was a long wait,until 7pm in fact, with no real clues to sure confirmation even then, athough there was a hint of 3 pk pd bottom at 526.From there we had some up, but it was short lived, culminating in a clear 3 pk nd top, along with a Bear Wedge just for extra confimation.Close was down 29.The 10 min chart now shows a trading range established, fom 10,500 to 10,650...
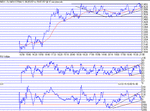
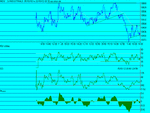
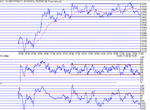
100 MA :10,566. Support : 10,568;10,550,10,528;10,500;10,475. Resistance: 10,592;10,610;10,660
 

Attachments

  • dow180302.gif
    dow180302.gif
    14.5 KB · Views: 532
So,onwards and upwards. Another tricky day, after the initial surge, left us wondering what to do next whilst we waited...We watched and waited and hypothesised adn were eventually rewarded with another breakout to 660, just touching 665.This was followed by a nice bull flag that got it's target spoiled by "Greenie"..700 would have been the target...After he said his words of wisdom, the DOW had dropped to 598, losing some 75 points.This was followed by a double take, before finally getting off the bottom again at 598, to close strongly at 635.The nice thing is we closed up 59 or so. Better than that, we had a clear wswitch from a strong intraday downtrend resistance to support switch, and a close above the 100MA. Tomorrow looks good for the bulls and 700 is not an unrealistic target.The down pressure hardly had any effect today, keeeping the channel bias firmly towards resistance, keeping alive the breakout possibility.
100MA :10,605. Support: 630,600,568. Resistance: 638,654,664,700.
 

Attachments

  • dow190302.gif
    dow190302.gif
    15.5 KB · Views: 488
Well, looks like I got that one wrong:( Still at least you can see the 30/70 RSI rule working to perfection, in conjunction with CCI +/- 100.Makes you wonder sometimes why we dont trade 10/15 min charts.Still I guess there are some that do....I won't dwell on today's performance, other than it was downhill all the way, losing 134 points. Those looking for the turnaround had a long wait. There were odd occaisions that looked promising, but they were short lived. Tomorrow needs to bounce off 500 or there's a big drop to come.....
100MA :10,569. Support: 10,500,475,432,400,300. Resistance: 10,516,532,542,575,600,632...
 

Attachments

  • dow200302.gif
    dow200302.gif
    14.6 KB · Views: 454
Well 500 got lost...and 400 and almost 300.....finding the bottom at 357. A good case of too much too quick I think. Maybe we can look forward to a "V" bottom and a nice typical Friday Rally tomorrow...At one point, it looked like we were going to close above 500, but it fell short at 493, closing at 480.
100MA : 10,493. Support : 10,448,416,400,386,357. Resistance: 10,500,528,576,600.
 

Attachments

  • dow210302.gif
    dow210302.gif
    15 KB · Views: 407
Final fling of the week....We didn't get the "V" bottom, well up until 490 we did, but then the whole thing just went pear shaped.The good thing is that we continued to come off the bottom making higher lows, finally forming a possible Bull wedge. If that preforms the target is 10,585 or thereabouts. Phase on the10 min. chart looks to be pushing to the upside, moving into positive territory late in the day, the lows from 350 being left way behind. Having failed to close above 436 is a concern for more upside, but the close was only 9 points down from that....
100Ma: 10,460. Support: 10,400,374,350. Resistance: 10,432,450,490,532,580
 

Attachments

  • dow220302.gif
    dow220302.gif
    16.3 KB · Views: 365
Top