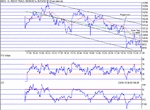
The DOW this week 22/04 26/04

ChartMan

Legendary member
Messages
5,580
Likes
47
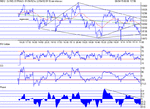
So, no breakout from the diamond today.There seems to be differing opinions as to the likely outcome so we'll just have to wait a few days and see how it progresses.Today's action was just downhill all the way. There were hints of 3 pk. PD bottoms on the 1 min chart along the way, but both were short lived. The final bottom for the day came at 110 around 8pm, followed by a run up to 136 for the close.Although the 1 min chart looked to finish strong, the 10 min chart shows no sign of recovery to the upside.....Having said that , the last touch on 100 was followed by a 130pt gap up on open the following day.Closing below the 100MA and the regression line doesn't leave much room for more downside.
100MA:10,187. Support: 10,132,110,100.Resistance: 10,150,164,184,200,232.
 

Attachments

  • dow220402.gif
    dow220402.gif
    16.6 KB · Views: 431
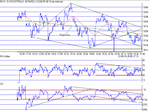
So the Diamond has finally played out as a continuation.Yesterday's 10 min chart showed the way for today, and I feel the same again- no sign of a reversal in the 10 min chart save the closing bounce off 070The open drop and recovery gave small hope to an up day,but was short lived.The continued consolidation around 150 and the bull flag gave a clue of things to come....the Bull flag failed- consistent with down trending and it finally failed at 162 with a last gasp rally before finally tanking to 070 to close up a few points at 089. At this rate 10K is under threat again.Failure to stay above 070/090 downtrend support will surely take us there.
100 MA: 10,158. Support:10,070,10K. Resistance:10,100,124,164,200.
 

Attachments

  • dow230402.gif
    dow230402.gif
    17.6 KB · Views: 374
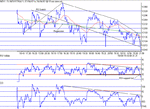
Well, a mixed bag today. Early action looked like a recovery was on the cards but by teatime it turned tail and went for broke, closing at 10,030. The peak at 161 failed to break through the regression line and subsequently dropped below the 100MA shortly afterwards, signalling the drop.By that time, there was a clear"rounded top" forming, adding confirmation to the inevitable.The noted RS switch also finally failed to provide a reversal support . That may well signal the end of 10K support. The only hope of a reversal now lies in the 3 slope resistance change.....
100MA :10,130. Support: 10,030, 10K.... Resistance: 10,050,064,100
 

Attachments

  • dow240402.gif
    dow240402.gif
    17.7 KB · Views: 395
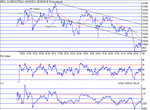
Is this a bottom? Was 10k a drop too far? after the first half hour drop to 9925, the rest of the day was uphill...or rather upwards.The 3 slope change yesterday turned into 4 slopes very quickly so I think that is confirmation of a true bottom....It took most of the day to recover from that initial LOD but Rome wasn't built in a day.The final rally of the day seems to be strong, having pushed much higher on the same level of TA (RSI/CCI) than the mid day rally that barely managed to push the index above 10k. The closing minutes just managed to push the Inverse H&S beyond the target of 035,finally closing at that value. The final part of the equation...to sustain a position 180 points below the regression line is not possible for very long....
Yesterday's RS switch trend line at 10,042.
With luck, Fiday will produce it's madatory up day. :)
100MA:10,055. Support: 10,026,10k,9975,9932. Resistance: 10,050,100,162,200
 

Attachments

  • dow250402.gif
    dow250402.gif
    16.5 KB · Views: 356
Well, we got some up, and almost made the Wolfe target around 80 odd....but that was it. The TA suggesting a true bottom was short lived , closing well down on the day after an encouraging start.From this I would draw the conclusion that there is a lot more down pressure to come. When consistently good TA forms fail, there can be only one conclusion.The short up to 82 was followed by a protracted consolidation between 9950 and 10K. More hope was provided by the fact that the H&S didn't perform "on the spot". This led to the first recovery of 60 odd points off the HS target at 9960 to 10,013 at 19:14.This was the second bounce and one could have been forgiven for thinking that at this point , the H&S would not perform, and so lead to more upside.....But from that top at 013, the dow just tanked, passing straight through the target...The only thing that went to plan was the inevitable pullback to H&S support ( resistance) at 9957. For the astute, this can provide a "bias beating" entry on CFD's or SB's. You know there's going to be a pull back to resistance, so just time your trade before the bias changes and you could pick up another 5-10 points, almost getting a "free trade"...
The bear Flag formed Friday gives us a target of 9880.The price is still well down on the regression line - 150 below and the switch from res. to supp. to Res. was nothing more than a false breakout and the second peak in the Bear Flag reconfirmed the downtrend resistance line....We have to bottom out somewhere...but where?
100MA:10,013. Support: 9900,9750( eod fib 23%) . Resistance:9932,9960,9984,10k.
 

Attachments

  • dow260402.gif
    dow260402.gif
    16.6 KB · Views: 315
Top