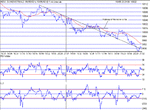
Dow Intraday charts 06/05 - 10/05

ChartMan

Legendary member
Messages
5,580
Likes
47
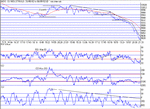
I suppose I should have seen the weakness in Fridays closing action- a move of only 70 points from an RSI of 83 and CCI of 293. Nothing interesting to report today, save the natural support at 9964 and 9932 then a bottomless hole....
Note the RSI uptrend around the support areas, and its inability to push the price up....Also 3 slope change. Will it be a bottom?
 

Attachments

  • 06_05_02.gif
    06_05_02.gif
    17 KB · Views: 369
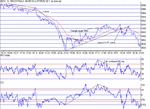
well, it was a bottom, but not too much upside....Triangle break to target and 3 pk nd top. Note confirmation of these as the price broke through the 100 MA...
 

Attachments

  • 07_05_02.gif
    07_05_02.gif
    16.7 KB · Views: 307
First, go back to the archives and see the intraday charts for 14/15 April.....and then look at the above 2 charts....
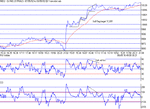
Apart from the 150 gap today, thanks to CISCO, we got a bull flag that met target, a 3 pk ND top and not a lot in between.
 

Attachments

  • 08_05_02.gif
    08_05_02.gif
    14.6 KB · Views: 320
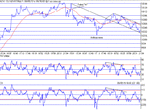
Not a lot to see today....just a slippery down slope...
 

Attachments

  • 09_05_02.gif
    09_05_02.gif
    16.1 KB · Views: 303
Even less interesting today.Just boring down down down. Let's hope we get something a bit more interesting next week...
 

Attachments

  • 10_05_02.gif
    10_05_02.gif
    17.1 KB · Views: 275
Top