Dow Intraday charts 28/05 - 31/05
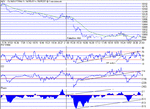
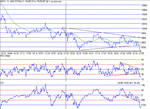
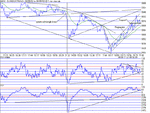
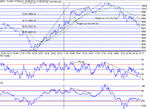
Great day for the bears. Well done Skim and the others who milked it dry. 🙂 The failed Inv. H&S at 9967 confirmed continuation of down trend, leading to a second bottom at 9967.Then a drift up to test and fail 10K with a H&S top that performed, and another test at 9967 to give a tripple bottom.Small rally into the close, giving a distinct SR switch. Will this be confiirmation of more down? The rise to 10,016 on RSI 72 and CCI 216 meant there was no desire to push up as it should have done with these values, but normal in a down trend.Then again , RSI 17 and CCI -213 should have made it tank , but it didn't. So we're in balance.....Phase on 1 min shows good positive divergence,and the tripple bottom may mean up tomorrow...we need to break 10K and stay for that...
Great day for the bears. Well done Skim and the others who milked it dry. 🙂 The failed Inv. H&S at 9967 confirmed continuation of down trend, leading to a second bottom at 9967.Then a drift up to test and fail 10K with a H&S top that performed, and another test at 9967 to give a tripple bottom.Small rally into the close, giving a distinct SR switch. Will this be confiirmation of more down? The rise to 10,016 on RSI 72 and CCI 216 meant there was no desire to push up as it should have done with these values, but normal in a down trend.Then again , RSI 17 and CCI -213 should have made it tank , but it didn't. So we're in balance.....Phase on 1 min shows good positive divergence,and the tripple bottom may mean up tomorrow...we need to break 10K and stay for that...


