You are using an out of date browser. It may not display this or other websites correctly.
You should upgrade or use an alternative browser.
You should upgrade or use an alternative browser.
Hi dsmondi
Please forgive me as I'm not that good at the 3 R's. However here goes.
The answer to your question is - the software does it for you !!!
Now that was'nt so hard was it ?
No seriously, we are all looking for market tops, bottoms,reversals and trends. So I use P & F as my home base as it were.
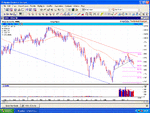
The chart above is a 100 pt. 3 box reversal.
each column is made up of O and X's and the value of these is 100pts. It takes 3 X's before any-thing shows on your chart from a down column of O's (that's the 3 box reversal part), then after that a X will show when there has been a 100pt. rise. The X's keep on going until there is a 300pt reversal, then 3 O's will show. Now you would use your best and favourite methods to decide if this was just a retracement or a full blown reversal. As you can see in the chart what most of us hope is the bottom I,ve drawn the red major support line, above that are the minor support line and the two resistance lines. After the big move up from 7300 ish we retraced 300pts (3 O's) the next column then showed a column of X's, this is the break-out. At this point I put my target on. Then I watch all you day traders (very nice people), to swing me in and out of the game.
If this does'nt make much sense, Chartman has kindly offered to help me out with the text.
Good luck
Greg
At this time I don't hold any positions
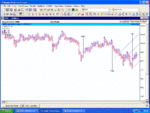
After the US bottoms which may be as low as 8000 or might have been yesterday, I am expecting a strong rally over 8640 and maybe much higher into next year.
The whole of the move from 9043 looks corrective.
I could be wrong but this is the best fit.
EW count.
http://stockcharts.com/def/servlet/Favorites.CServlet?obj=ID54819
Regards,
Ian
The whole of the move from 9043 looks corrective.
I could be wrong but this is the best fit.
EW count.
http://stockcharts.com/def/servlet/Favorites.CServlet?obj=ID54819
Regards,
Ian
You can tell I'm bored,I'm looking at the Pre dinosaur Dow charts 🙂
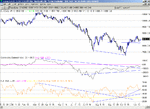
Anyway, interesting point here. Those that have followed my rantings for a long time will recognise one of my pets- the 3/4 trend line slope change. Whichever way you look at the chart, we have had the fourth down slope rate of change.I dismiss the downtrend resistance line that touches 9000 on 21/05 as it doesn't fit the " end of downtrend profile" that we see on the intraday charts that prove so reliable. This must bring smiles to the Bulls out there... Not that I'm going to rush out and go long on Monday- to the contrary. But I think I'll look to top up my pension soon 🙂 ..... We have an Inverse H&S that has a target of 8800, which is where we are today. We have a nice Bull triangle on RSI too.
All in all, it seems to me that everything is stacking up the same way in all the time scales.To me , that adds up to 10,500, which just happens to be the last major high. Timescale? Mid March.....
On the other hand, it could all go belly up and we take a dive to 6000, but I don't see it.
Attachments
FTSE Beater
Experienced member
- Messages
- 1,518
- Likes
- 6
Oh dear CM - I thought this might happen after you got married - ah well 🙄You can tell I'm bored,I'm looking at the Pre dinosaur Dow charts
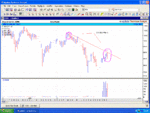
Anyway, I would want to see S&P clear 960 before I dust off the old Bull cap. 960 is the neckline for the H&S that started back in 1998 (I'm sorry but I can't find a charting package that goes back that far), so a break above that would be significant.
Having said that the Dow does look strong and with the European markets looking strong this morning, something might just start happening
AIMHO 🙂
Attachments
Published in Hedge Funds Review
14th October 2002 – Monthly Chart
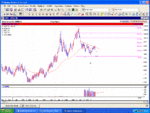
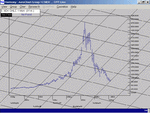
The Nasdaq has hit its long term upward sloping support line and I expect that we will have a very good bounce from this level, at least in the order of 20 – 25%. The system in issuing a Buy signal at 800 with a Stop at 750 and a Target up at 2300, long term. Market manias such as the dotcom bubble normally retrace at least 80% from their top. Here we can see that, if I am right and this is THE bottom, the Nasdaq dropped some 83% from its March 2000 peaks. Never in history has so much money been liberated from the pockets of the foolish.
Attachments
Nasdaq Update - 2003 Looks to be a positive year for stocks
7th January 2003 – Monthly Chart
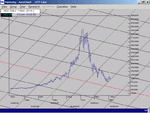
Has held the upward sloping line of strong support and now looks to be headed higher into 2003. The Stop is now at 900 and the Target is up at 2440, long term. The original Buy signal came at 800 and with the market closing tonight at 1063 that equates to a better than 32% winner so far.
Attachments
it looks to me that we are headed into the short squeeze of the century if the SP can take out 966. Cycles suggest that the major indices are within 1-2 weeks of a major rally which could last for the next 3-5 months, taking the Dow to a new all-time high and the Dax to 4800. The bearish engulfing pattern on the monthly chart in the SP may have been an anomaly due to the +800 hedge funds going out of business in December. I have looked at the chart from several angles, the geometry looks pretty goodm and the fixed cycles look set to provide the fuel needed. I day-trade the SP futures so i am not too worried about the long-term although i might buy a few keepers. The way i would play this was to buy way out of the money options for June expiration. Bear in mind though that the rally we have seen over the last couple of days could have been elaborate scam for the arbs to get some cheap puts but after today, seeing the inability to press for lower prices, I doubt this is possible and with COT report showing the commericals net short in a big way, the stage is truly set for a rally. Good luck
Sunseeker
Sunseeker

