Day trading the DOW 17/03/03

It's historical..... I used to use AIQ for charting. Their CCI algorithm is different to Sierra. I found AIQ CCI (90) to be an absolute superb divergence indicator. After a lot of experimentation with Sierra, the closest I could get was with a value of 150. Iv'e tried 42 ( woody, 3 min cci ) but found it too violent. Please don;t let my personal preferences affect your choice. It's imperative that each individual finds their own feet, even if they chose to try someone elses settings first. I did just that.
Apart from that, I have tried 42, but found it too similar to RSI 14 so I saw no point in having two indicators telling me the same thing. CCI 150 assists in calling the end of longer term trends during the day....
I'm not trying to push you this way as you may have very good reasons to use CCI 42, but take a look at todays chart- the "rule of thumb's are":- Either use zero as a trading signal ( safe) or the +/- 100 crossings- more profitable/more risky/more losses.
I don't use them to trade, as you know. If one were to combine the atributes of CCI with the price action/100MA, it would be more profitable, securing better entries and exits. But then it's yet another set of rules.....
 
Another reasonable day's trading. I've been a naughty boy and tooks some risks today trying to pre=empt moves, causing me a few points loss on ES. but two moves paid of handsomely- one anticipating the first bottom at 15:30 and taking 8.5 points, and the second at the triangle break at 17:12 taking anther 8.
The "special cover and long" was an exceptional "reversal trade". There were sufficient clues to take the gamble. First the preceding divergence. Then an inverse H&S. Half way up the right side of the Inv. H&S there was a bull pullback.Then there was the big bull flag right below the 100MA. The break here was the signal for cover and go long. That still only got 30 nett, probably 10 after bias... :( Taking the normal 100MA +20 exit would have given a nominal 10 point loss. Not so bad. so long as you went long at the same time.... The second short would have been a net zero trade. :( Still , the final tally should have been over 100 for a day's gain of 25 or so on the dow. We can be the market, can't we?..... :)
 

Attachments

  • dow 20-03-03 1 mina.gif
    dow 20-03-03 1 mina.gif
    23.8 KB · Views: 630
ES chart, showing premarket action. This gives a much better "overall view" and is still showing good opportunities on the 100MA. Shows a slightly different picture to the DOW..... A useful double edged sword. Same TA, same target calcs, same opportunities......
 

Attachments

  • es futs20-03-03 1 mina.gif
    es futs20-03-03 1 mina.gif
    26.6 KB · Views: 631
Hello again Chartman.

Have you ever tried applying your methods to the FTSE100?

I know you specialise in the DOW mainly but wondered if you had done any observations as to wether your methods worked equally well with the FTSE.

I have been looking at the FTSE action today with the 100ma and RSI. It seems to work OK but that's only one day. I'm not really familiar with any "quirks" of the FTSE.

Does anyone have any hints regarding the FTSE. ie not to trade between certain times etc. I relate this to the US indices where some well known observations are for example quiet market between 5 & 7 pm (US Lunch). Decent price action in last hour or so as european traders come in to the market etc.

Grateful for any feedback.
 
Yes, I'm sure it would work. Trouble is, it will take a long time to evaluate, re-evaluate etc. just as it did for me on the DOW.
I'm a very strong believer in the fact that every stock/instrument has it's own unique identity whilst still being broadly compliant with all the run of the mill TA rules. It's this unique identity and characteristics that will give you an edge in your trading.
I see nothing wrong with using my techniques/algoriths as a starting point and take it from there. Unfortunately, I don't have time to help you ( or anyone else) further than this.
I you do take it on, please report your findings.....
 
Another great day and a good finish to the week,up 700 points. It's really nice to get the best guess on the comp too. A bonus . :cheesy:
The hard bit today was having the B**** to go short at the open. I picked a bad entry early on at 884 on ES and regretted it, but played it off against TA and support, to finally close for +11. :( Should have been close to 20. That's what happens when you don't concentrate 100%... don't say I haven't warned you. Talking of that, I want to tell you about "position sizing". It's important to know what you are "comfortable" with. If you size is too big, (smirk) you will quickly find fear and greed bocoming the controlling factor in your trading decisions. I had to sit back a while ago and figure out where I was falling over. I finally figured it out. I was trading too big a proportion of my capital and I was getting spooked out of trades, and taking profits too quickly. So I decided to reduce my size by 80% and hey presto! You won't believe the transformation . Relaxed trading, no fear, no greed, no rash decisions (almost) and I feel totally in control of my trading. If things look pear-shaped, I sit back and look at the bigger picture. I don't give a dam if the price continues to move against me. I KNOW I will arrive at a balanced decision based on all the facts that I can see in front of me, and not the fact that my bank balance is being eroded.
If you are freaking out of trades, killing winners and getting it all wrong, maybe you should take a look at this. For reference, I trade 0.5% of my capital per trade. ( I only have 1 position at any given time.) The actual figure is not important. Others say 0.03%. I can't argue against that. It has to be what you are comfortable with and only time will tell you if you have the right %...... For those beginning, I can't recommend any more than 0.1% of your capital. 1% is just suicide......
Quick sums.... if you have £1000 in your account, then try £1 per point. Trading the DOW with the 100MA SHOULD mean your worst case loss will be about £50, or 0.5% of your capital. With this lower stake size, it means that you can also add to a position as you ( and the market) gains confidence in the move without becoming induly afraid of losing. IF you add to a position, you MUST throw greed out of the window and take your profits on purely TA grounds, not the dosh you may have in your pocket if you hold on "just a bit longer". Once you give in to that mentality, you will run the risk of holding and holding in the hope that it'll go back up ( or down). IT NEVER DOES.
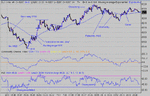
Any way back to the charts. 3 good long entry points as shown with the ONLY exit at 8520 just before the close at 20:54.
Why not the 8520 at 20:40 I hear you say..... well, there was a very close exit here for a 3 peak negative divergent top BUT at the final peak, RSI broke out to the upside, cancelling it, indicating more to come. As it happened , it was very little. IF in doubt, cash in your profit and no-one would have blamed you for getting out at 20:40. That long entry was worth 160 points and 8:1 R/R ratio.
For the record, my bad entry was at 15:51 as the bull flag produced a false breakout. I was convinced as the price had previously bounced off the 100MA at 8340. On reflection I held, anticipating that the price action would develop into a real bull flag, which it did. I anticipated the 3rd low peak at 8320 and set my exit just below there. It was touch and go because I was looking for positive divergence, but it never showed. But on reflection, it wouldn't because it WASN'T a bottom, just a pull back!!!. IF i had been using a bigger position size, I would have undoubtedly closed out for a loss, and then been frightened to go back in again, compounding a lack of confidence. No more of that. Considering my error, I guess I can say I came out smelling of roses, but I should( could) have got close to 200 points ( 20 on ES).
For what it's worth , the actual ratio of the DOW to ES varies around 9.3 to 9.5, but I make my comparisons at 10:1 for simplicity.
 

Attachments

  • dow 21-03-03 1 mina.gif
    dow 21-03-03 1 mina.gif
    19.3 KB · Views: 563
Well done mate, I wouldn't mind £7000 on the week. I'll have to follow you more closely.

Be lucky,
 
Yup,
I'll second that, nice one ChartMan.

Oh, oatman, as regards following ChartMan......get in the bloody queue ! :LOL:
 
trading ftse times

Does anyone have any hints regarding the FTSE. ie not to trade between certain times etc. I relate this to the US indices where some well known observations are for example quiet market between 5 & 7 pm (US Lunch). Decent price action in last hour or so as european traders come in to the market etc.

Grateful for any feedback. [/B][/QUOTE]

Would say a.m. most movement is finished by 11 am, then wait until U.S. market opens at 2.30 p.m. for further developments!
 
Hi Twiggy2,

I trade Ftse Future and normally wait 'til about 08.20 for my 1st trade. I like to let it settle. There's often a good move reversing some of the opening moves. ie opens 50 down, bit of sideways, recovers 20 or 30 or fills a gap. I agree it's done by 11am. Go shopping or do the garden! You'll go mad :mad: sitting alone staring at screens all day. Then you've got NY which livens things up. Watch out for "numbers" at 13.30 , 15.00 :confused: . It's your choice whether you want a position then :0 . Then you've got the last half hour 'til 16.30 cash close can be interesting, window dressing etc. I don't normally have a position after about 16.45.

Be lucky,
 
Errrr, guys, I meant the Index gained 700 points, not me. I did a tad better than that which pleased me no end. :)
Just one final point about this DOW strategy. Please don't assume that just because this is what I preach, it is what I practice. I DO, for the greater part, but use my skills to make strategic decisions in an attempt to increase my gains ( and losses).
 
DarrenF and others.... I've had a quick look at FTSE intraday adn the correlation is very similar. The decision is to discover how wide to make the stop points..... I'd guess between 10 and 20. It's certainly not pr rata against the dow, is <10 . Worth making the effort to look into it in depth in my opinion. :)
 
Thanks for the reports Chartman. Having tried my hand at working out my own TA based entry/exit points (paper trading), I find that part of the trick is in recognising the patterns AS THEY DEVELOP- Ihad the first bull flag pegged as an expanding trangle at first. All good fun though.

Just one question , how did you work out your pullback target of 8481?
Also once, about six months ago I was trading for real with the time approaching market close (D4F SB) and got trapped in the market over the weekend. Not a pleasant feeling.

In the event, the price moved in my favour but I don't want that sort of anxiety too often. So, I wonderd if you may have set yourself any guidelines or rules in relation to this?

Thanks once again for your commentaries, they are certainly appreciated.

Best Regards,
Neil
 
Chartman take a, Chartman take a bow...

Yes - huge pat on the back and thanks to you Chartman for your time and energy. I know I keep saying this but this Board is SO enjoyable and useful. Just wanted to ask you what company you're using to spreadbet with ? I'm sure we'll understand if you don't wish to make it public ;) I was just wondering what kind of spread you were getting and if you had experience of different companies, particularly with reference to the DOW spread you get and the way it moves as it is integral to your system is it not ? I mean can you ignore the spread and just take your cue from the cash price on your charts ? (I believe you've suggested this somewhere else ?) I'm curious because I placed a daily FTSE cash SB this week with Cantor and the spread moved insanely..I mean it was absolutely infuriating. It was a good 15 points above and below the price for a couple of hours. HELL ! There would be no way you could trade profitably with their spread without keeping a very close eye on it (and I did on both counts). Is this really the futures price that is being quoted or is it being manipulated ? Then later on with the daily DOW cash the spread was sedated in comparison. Much more predictable. Anyway, thanks again for your work. It's tremendously helpful. I look forward to your posts. And yes i'm going to change to D4F ASAP unless you suggest otherwise: acronym city!
Jesse.
 
Ftse Future is quoted 1/2 to 1 point on the bid/offer 99% of the time.

Good luck,
 
thanks chartman for taking the time to look at the ftse chart. I'd agree there seems to be a large degree of correlation and probably a smoother trend also. (but again, only one day to compare so far). I will track this for a few weeks I think.

Also, just on the subject of spreads, the spread price (certainly with D4f) ie based on the futures price which can vary drastically from the actual index price especially in the early part of open market hours. The actual index price usually moves rapidly towards the futures price on open, then usually settles down within half an our or so of market open. Personally, I think the best way to deal with this is to trade the actual spread price by using the SB (or futures) charts rather than the actual index (I use df4).
I'd be interested to hear from others (especially chartman) regarding this subject.
 
BAnsir, and others- re targets. I have my own rules that may differ to text book theories.
take a look at this "7 leg rise". The first 3 legs have targets of 100 points up from the lowest price in the pullback. rise 4 is only 80 points- a clue :) .... it's weakening. add this 80 to the low.... =8050. For each leg up, for the move to continue, the price MUST CONFIDENTLY reach the target. By this I mean no dithering in the middle. ( As in the the 7860 region.) If you reach target, you will soon get a pullback.
Here you have 2 choices. Exit or stay. That has to be according to your trading style.
In the final leg, 8,9, the target was 8100 which fell short.But we expected that , didn't we......
Triangles have the same target calcs. Take the MOUTH and add it to the low before break to the up-side, or take it away from the peak in a break to the down side. Forget the shape of the triangle - they all mostly work.
Target calculation is a key tool in your arsenal.Without it, you will be missing a lot of points.
A final word, the numbers are never exact. This is a text book example. Expect to be a few points under or over. In any case, this example happens to fall on some very convenient numbers. Usually you get odd numbers. When trading you need to make a quick approximation at first. Then, as the move progresses in your favour, take time out to try and get exact as you can.
You should alays be looking for traditional TA formations, but DON'T look too hard. If it doesn't jump out at you, it probably isn't there. Remember, as you have seen, that a move can "develop" into a different formation from that which you originally saw.....
 

Attachments

  • targets1.gif
    targets1.gif
    12.6 KB · Views: 490
Jesse, I use FINS. I have said it before. Base your trading and decisions on your charts. Then place your trade. BUT I always make sure that ( like you had on FTSE) I'm not being robbed blind. I'll take a 10 point bias...... This is acceptable, because of the likely moves and R/R on the DOW. If I take a 100 point move and give away 10-20, so be it. I'm tired of fighting the system. I know what I'm dealing with and (begrudgingly) accept it.
You may find D4Free has a better bias on DOW. I don't know.

Darren, Jesse, are you using FTSE futures chart? It may be stating the obvious, but if you're trading the Futs, then you must use Futs charts..... Or have I got the wrong end of the stick? :)
15 points bias on FTSE is untradable.....
 
Chartman

Currently using d4f charts which obviously are based on their own prices. Their FTSE price (or s&p500 or many others) are based on the equivalent futures price and should track the futures price, I would expect within a point or so all the time. The wider spread on SB can cause some bias if the "fair" price is right at one end of the spread but shouldn't really be more than 2 points on the FTSE when compared to the futures price.

What I am saying is that the d4f (and subsequently) futures price will vary greatly from the actual index price in the early part of actual open market hours, often for 1/2 hour or so, until the actual market and futures market find an equalibrium, after which there is much less variation.

Chartman, when you say you get bias of 20 points on the DOW, do you mean that the SB price is 20 points away from the actual index level. If so, do you trade off the actual DOW index chart or from the FINS chart? The charts you post appear to be the actual DOW index. I have noticed the ES charts you post are futures as you are trading pre market. I have been tracking the D4F S&P 500 charts and they too seem to follow a near identical pricing to the futures (as I would expect). The only big differences come when you look at the futures (or d4f) compared to the actual S&P500 index, especially in early hours trading.

Interested to hear experiences on this from anyone.
 
I have seen 20 points bias away from the charts.. but I actually mean a nominal 10 points each trade. FINS charts are non existant... I use the DOW index and S&P Futures for charting.
 
Top