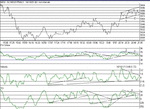
Check out the trend lines on the 1 min intraday chart.Following the trend lines and executing trades accordingly would have netted a lot of points. NOTE the positive divergence on the tripple bottom at 9300 and the exit point around 9380 to 9388 which had CLEAR negative divergence. I got out at 8985.
The lower lows on the indicators, compared to the higher highs on the DOW should have hit you like a brick and made you hit the sell button. Equally, the pd at the bottom should have got you scrambling for the BUY button around 9320.....
Good fun isn't it? 🙂
The lower lows on the indicators, compared to the higher highs on the DOW should have hit you like a brick and made you hit the sell button. Equally, the pd at the bottom should have got you scrambling for the BUY button around 9320.....
Good fun isn't it? 🙂

