Dow Intraday Charts 10-14 Jan 05

gollum

Junior member
Messages
35
Likes
0
Hello all, haven't been able to look in for a while as PC told me i had bad clusters ..
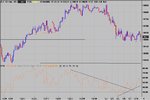
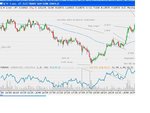
Looking for a bounce off the bottom trendline at around 570 ..
the top trendline is at around 664..
If we decline the top trendline to touch fridays peak then i believe we are looking at a triangle of some form.. And then maybe price touching 570 will mean a breakout..
apologies if this is wrong but i just want to keep these threads going... :cheesy:
 

Attachments

  • dow dly to 7  jan.gif
    dow dly to 7 jan.gif
    25.6 KB · Views: 378
Last edited:
Running on a mixture of methane and helium now. 10400 is one goal in the 60m chart..
Same goes for some sector indices. TRAN is weak as well as the NDX100 & Nasdaq. Telecoms are weak as well as Drugs. Time to buy end of Feb.
 
maxpain said:
Running on a mixture of methane and helium now. 10400 is one goal in the 60m chart..
.

Like 10425 50% fib retrace, still have to get through 10578, 25% and horizontal support from 2 prior swing highs. With earnings kicking off this week could go anywhere :D
 
This is very interesting because , the cash at this moment, is at the same price at which it opened.
One wonders whether it will lay an egg or not, because it has decided to creep up again..
 
Well, it is now closed and it did not lay the egg after all. It closed roughly in the middle of its rangebound
arena. I am not predicting, I am only commentating.
 
Seems to mee that the bears can't get a hold of this and neither can the bulls. Seems to me this move has got one more attempt at a high around 680 to complete the third cycle and then break or drop..... I think the key is in CCI failing to make the last low of the expanding triangle.
 

Attachments

  • dow 10-01-05 10.gif
    dow 10-01-05 10.gif
    42.6 KB · Views: 379
Nice run from the triangle breakout to T1. Difficult to catch... But you should have got the RS Switch bang on 32, running to 64 and an out on the triple top with ND.Worth a stop and reverse? Take a look at ES vol and CCI well into OB on the first try at 64. Cover on the bounce off 32, just in case, and then back in as it finally drops through 32 on it's way to 590, and again CCI/RSI well into OS for a cover and another good opportunity for a stop and reverse. Don't get many of those to the pound. :(
Keep the posts coming.......
 

Attachments

  • dow 10-01-05 1.gif
    dow 10-01-05 1.gif
    31.5 KB · Views: 391
Well Chartman, let us remain open minded about it and see what develops next.
 
SOCRATES said:
Well Chartman, let us remain open minded about it and see what develops next.
Quite. Close your mind to either side of the equation and you're doomed.
 
frugi said:
A rolling bottom perchance? A bit spooky how the 7/1 low has two similar higher lows on each side if it. If tomorrow "completes" the pattern shown over the past 5 days it might go as far as 750 tomorrow. Any outcome is of course acceptable :D

A rolling bottom it is, but will it deliver the goodies?As always, we'll know tomorrow. :cheesy:
 
Hi CM,
R/S switch perhaps?

Neil
 

Attachments

  • Image1.jpg
    Image1.jpg
    112.4 KB · Views: 264
Another hugely frustrating day for me - I keep out of the chop well but missed all the moves. Well, I resolved to be disciplined this week so I guess that's a likely outcome...

9:47 1) S 10643. Missed the up move so looking for a quick CT on ND. No follow through. Eventually gets through 40 but stops.
10:52 EXIT: +1 on lack of movement. Then it breaks a couple of bars later.

Runs along the 100ema for 2 hours before breaking up at 13:15 (without me on board). Then sideways along Friday's HOD.

I'm being picky about entries today (after last week's fiasco) but I'm just not seeing anything I'm confident with here.

15:00 2) L 10642. For another move up. But cannot get through 50. Twice.
15:05 EXIT: +1. Jeez.

Then drops like a stone without me getting in again.

+2 from 2
B/e for the day after commissions
-36 for Janaury so far after commissions (6 days of trading)
 

Attachments

  • 20050110.jpg
    20050110.jpg
    374.7 KB · Views: 300
See my post number 5 above. Well the egg has been laid, at a low so far of 10548, a few minutes ago, from last night's close at 10621.

Chartman, I am following your good advice and not predicting,
just commentating on what I was not predicting last night, so as not to............
you know what I mean.

Kind Regards As Usual.
 
Re post 5
Hands up who knows in a market context ,...what laying an egg means? : ) Is this some esoteric technical term?
MJ
 
Yes. Haven't you ever come across it? Frequently used in dealing rooms, amongst dealers familiar with an instrument, meaning something imminently expected, look out, watch it etc.,
 
The time now is as marked ~ here is the trough of the last wave from10582, sweeping at 10544.
 
At 1806 it touched 10532 on momentum for only two minutes and then recovered, it is now 10580 again, running out of steam, up 36 points from the trough pinpointed in post number 17 above, when sweeping was completed.
The lowest low in the index was thus only 12 points below 10544 and attributable to added momentum.
Check it out and you will see how accurate it is, for two bottom picks in a day.
 
That was a good call Soc. As spotted by Chartman, 32 and 64 are rather magic on the Dow, in that there is often S/R or a reversal close to these numbers more times than a random distribution would allow.

By sweeping I assume you mean the sweeping up of contracts from weak hands and frightened retail bulls who bought too early and can't take any more pain?

If so I am interested as to how you knew that this was happening, as opposed to, say, an imminent continuation of the down trend. I attach a one minute chart of the Dow future YM. I hope the P&V patterns are still clear despite the irksome presence of stabilisers and annotations.

Did the volume patterns at 17:49 and 17:59 to 18:03 give the clue?

I saw a selling climax then a lower low to 32 (at 18:00 time pivot) on less - but still relatively high - volume. Often this "volume divergence" phenomenon is more pronounced, i.e the 'second' climax volume bar, at the low, is less then 2/3 of the length of the first climax bar, but on this occasion it was only a little shorter, perhaps indicating real buying pressure as opposed to a mere lack of new sellers?

After a selling climax of the former variety the following price action is often flattish, with retest(s) of the low, but this time the higher volume pattern together with the time of day and price level pointed to a possible fast V type reversal, but this was a guess not a definite "Oh they're sweeping now let's get long" judgement and I didn't personally go long, though had I more skill I might have done with confidence.

Your, or anybody else's comments would be welcome. Thank you and best regards.
 

Attachments

  • untitled.JPG
    untitled.JPG
    82.7 KB · Views: 226
SOCRATES said:
The time now is as marked ~ here is the trough of the last wave from10582, sweeping at 10544.

Could this also be explained as Market symmetry with equilibrium at 560ish?

Also did you see the inverted head and shoulders at the break of 560?
 
Top