You are using an out of date browser. It may not display this or other websites correctly.
You should upgrade or use an alternative browser.
You should upgrade or use an alternative browser.
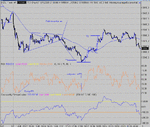
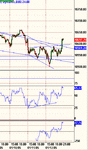
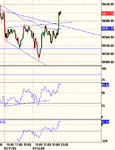
Looks like Chartman beat me to it .... rolling bottom cancelled and the "new channel" seems to have been wrong and we have returned to the old channel.
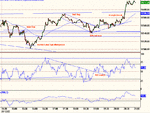
Divergence showing on the last two lows on the 10 min chart, don't we normally need 3 before we see a significat move up?
Divergence showing on the last two lows on the 10 min chart, don't we normally need 3 before we see a significat move up?
Attachments
justyn said:Looks like Chartman beat me to it .... rolling bottom cancelled and the "new channel" seems to have been wrong and we have returned to the old channel.
Divergence showing on the last two lows on the 10 min chart, don't we normally need 3 before we see a significat move up?
We need to see 3 daysof PD, usually, on the 10 min chart before a turn... the last one failed on the 4th ( turnround) day.
A challenging day IMO but the opportunities were there ..
The pullback to 584 at the open was worth shorting and delivered its target of 40 points (sorry I can't annotate my charts as well as CM)
The 3 pk bottom / Inverted H&S prompted a long but failed to close the opening gap. I couldn't quite work out where the triangle was although I was sure it was there ... or was it a rectanglular area of consolidation between 85 & 64?
It was worth shorting when 64 broke and the flag half way down gave a target circa 32. With the ES volume spike already mentioned along with the fact that 32 often gives a reversal and also the fact we were almost 100 down from the open it was likely we wouldn't go down any further.
8pm and it looked to me like a bull flag which failed to deliver - and it pulled back to 64 so perfectly as well!
I traded the breakout but with news due out from Intel I wasn't surprised that there wasn't enough momentum for a good push up.
Hope everyone did well today.
Justyn.
Attachments
Last edited:
SOCRATES
Veteren member
- Messages
- 4,966
- Likes
- 136
Hello Frugi, first of all congratulations on being appointed a moderator. I would like to take this opportunity to wish you well in your new post. I am confident you will do a very good job of it.frugi said:That was a good call Soc. As spotted by Chartman, 32 and 64 are rather magic on the Dow, in that there is often S/R or a reversal close to these numbers more times than a random distribution would allow.
By sweeping I assume you mean the sweeping up of contracts from weak hands and frightened retail bulls who bought too early and can't take any more pain?
If so I am interested as to how you knew that this was happening, as opposed to, say, an imminent continuation of the down trend. I attach a one minute chart of the Dow future YM. I hope the P&V patterns are still clear despite the irksome presence of stabilisers and annotations.
Did the volume patterns at 17:49 and 17:59 to 18:03 give the clue?
I saw a selling climax then a lower low to 32 (at 18:00 time pivot) on less - but still relatively high - volume. Often this "volume divergence" phenomenon is more pronounced, i.e the 'second' climax volume bar, at the low, is less then 2/3 of the length of the first climax bar, but on this occasion it was only a little shorter, perhaps indicating real buying pressure as opposed to a mere lack of new sellers?
After a selling climax of the former variety the following price action is often flattish, with retest(s) of the low, but this time the higher volume pattern together with the time of day and price level pointed to a possible fast V type reversal, but this was a guess not a definite "Oh they're sweeping now let's get long" judgement and I didn't personally go long, though had I more skill I might have done with confidence.
Your, or anybody else's comments would be welcome. Thank you and best regards.
In the above post you refer to the second call.
The first call I was very reluctant to make last night because I have taken Chartman's advice with regard to making predictions in public.
So therefore as today's outcome at the open and subsequent fall and to the level was already evident to me, I did not want to upset anyone and therefore restricted myself to giving humurous veiled clues to all of you before last night's close but in a way that I could not be accused of futurologising the event.
This is also as a measure of self protection as I am not willing to be pilloried for giving results in advance. Also I cannot and will not allow anyone to accuse me of giving investment advice.
That was the first call and bottom pick. In my circle we call laying an egg an event that is imminent whose outcome is known in advance but whos exact start point in future time is difficult to forecast in net present if one is not correctly "tuned" or if there is interference with the "incoming inference".
The second call was done because of the behaviour of the price as the action showed a propensity to develop.
On this occasion it was done using the cash market live, without charts running at all. It is as a consequence of having a complete mastery / famitiliarity wiith price and volume development.
What I am telling you is very advanced and is beyond a chart, and I have no intention of boring the audience with explanations, which in mechanical terms are not explainable, and only apply to check in real time the instant that the price level is forseen. So you see that my use of a chart is very different to everybody elses.
The concept of sweeping is not what you assume it is. It relates to the manner in which the price is progressed or retarded involving the use of time in non linear mode. The result as recorded on a chart displaying volume would illustrate this in mechanical form.This is the differece between attending a concert for example against hearing the music recorded on a CD or tape.
That is as far as I am able and willing to explain publicly.
Kind Regards and I am pleased you like it and that you find it interesting.
TraderTony
Active member
- Messages
- 180
- Likes
- 1
9:51 1) S 10561. For another leg down having wimped out of the earlier, perfect short signal at 9:42. Nope, not going.
9:53 EXIT: -4. Another cracking start - missed the winner and took the loser.
10:20 2) L 10566. On triple PD looking for move back to S1/yesterday's low/100ema level just over 580.
10:22 EXIT: +16. Now that's what I'm talking about. Good choice of target even if it goes continue up after a pause.
Longer time frames suggest a break down and the triangle seems to have given way to the downside with a triple top in place but it's hanging up there. Maybe it wants another touch of 600. Finally breaks (as ever at the moment - without me on board) but no great follow through as it bounces at 550.
12:48 3) S 10555. For next leg. Moves nicely then spikes straight back up. Dangerous.
12:52 EXIT: +1. Frustrating.
12:54 4) S 10552. Try again. Erratic. Then moves. Stuck to 550 level. Then down. S2 at 540. Stalling here. WIll take some points.
13:01 EXIT: +14. Looks like a decent exit again. Well, at least something is starting to come back.
Then a powerful move back up to the congestion area at 560.
14:45 5) S 10579. No immediate break but looks like a small bear flag or a bigger head and shoulders. Goes against. Then breaks but bounces hard off 570. I was hoping for a sharper move. Dilemma now.
14:58 EXIT: +5. Disappointing but choppy here.
Triangle bound until the close.
+32 from 5
+27 for the day after commissions
-9 for January so far after commissions (7 trading days)
Attachments
feelings
Hello all,
Just been reading back through the posts since last week. WD to those who have continued to report (unlike me) and comment on the market.
Wthout mentioning any names ... I'm sat here listening to Elgar's Pomp and Circumstance and thinking of that old adage ... if you can't blind them with science, baffle them with bull****.
Justyn, thx for the email, I hope you're trading successfully. I'll be in the chatroom again today ... all on my lonesome🙂
Graham
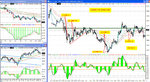
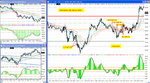
Hi CM or Justyn, Just so i have this correct....Are you are seeing a Volume spike (V:3036) at 13:00 on ES`h which is 2 mins before the turnaround on the DJI chart ? Does this happen fairly regularly..? I mean do u regard it as a strong buy ? As there was no PD on RSI or CCI..
At what levels would u regard RSI & CCI oversold.?
At what levels would u regard RSI & CCI oversold.?
gollum said:Hi CM or Justyn, Just so i have this correct....Are you are seeing a Volume spike (V:3036) at 13:00 on ES`h which is 2 mins before the turnaround on the DJI chart ? Does this happen fairly regularly..? I mean do u regard it as a strong buy ? As there was no PD on RSI or CCI..
At what levels would u regard RSI & CCI oversold.?
There's no absolute value for a volume spike, you have to read in context with what has recently happened- low vol? high vol?. If you see a spike that's 3 x normal volume, then you can act on it. Same with RSI and CCI ( posted elsewhere) - somedays RSI will be OS at 30, other days it may be as low as 10.... same for CCI. You just can't look at these things in isolation.
Chartman said:
As discussed last night the 3 pk PD bottom on the 10 min chart with a last bounce off the channel bottom produced a nice move up. 80 points up, 50% retrace then 80 more up.
Looks like there was an expanding triangle in there as well.
We need to see 3 daysof PD, usually, on the 10 min chart before a turn
As discussed last night the 3 pk PD bottom on the 10 min chart with a last bounce off the channel bottom produced a nice move up. 80 points up, 50% retrace then 80 more up.
Looks like there was an expanding triangle in there as well.
Attachments
Quite an easy day IMO. Got a little choppy at the end before the triangle broke but on the 10 min chart it looked like an expanding triangle so maybe that explained the volatile movement.
I think the best entry for the second leg up was the divergence at the bottom of that bull flag. If you entered when the price was around 560/570 then with the wild fluctuations on the futs price you would have been brave to hold on for the end result.
Hope everyone did well today!
Justyn.
I think the best entry for the second leg up was the divergence at the bottom of that bull flag. If you entered when the price was around 560/570 then with the wild fluctuations on the futs price you would have been brave to hold on for the end result.
Hope everyone did well today!
Justyn.
Attachments
The expanding triangle I mentioned in post #31 ...
Do expanding triangles have a target in the same way as conventional triangles?
If so the triangle mouth is between 80 & 100 points. A pullback at the open today to triangle resistance at 590 could produce another move up to 664 IMO. If we get to 664 I think we could see 700 by the end of the day
Pure guesswork of course ... as always trade what you see not what you think!
Justyn.
Attachments
TraderTony
Active member
- Messages
- 180
- Likes
- 1
So tempted to go short early from the sharp reversal off the 100 ema and below the pivot, but caution being my watchwork this week I passed and so missed the beatiful run down to yesterday's LOD. Ditto the next one after the sharp pullback exactly to the pivot. I'll loosen up a bit once I've had a few solid days but must stay disciplined just now.
10:38 1) S 10537. Loking for breakdown to new lows. But has to take out 530 area which is already a potential double bottom at S1 level.. Yes. Then sharp bounce.
10:41 EXIT: +10. No clear exit but I didn't like the hook back and decided to start with a winner for about the first time this year. But obviously I should have held on!
Sharp pullback from 501 back to convergence of 100 ema, yesterday's LOD and S1 level around 532. Stalls a bit then pushes again.
Long signal at 11:28 but too nervous to take it with all the resistance above. Which proves wrong again as it shoots through and up and away. Flip. And it hits the pivot again . Talk about leaving points on the table - that move hit a peak of 50 points from my entry signal without even touching the wrong side of the 7 ema.
I've just got to stay patient a bit longer though while I put last week behind me (keep repeating over and over to stop me getting reckless!). At least I am starting to read the market much better again.
I hate missing all those points though. Will be just a little more aggressive this afternoon.
13:21 2) S 10573. Creeps down. Hoping for move to at least 550. But no.
13:35 EXIT: +12.
13:46 3) S 10556. Try again. Stalled. Then down. But bouncing at 540 level. Looks like it's done.
13:57 EXIT: +8.
14:10 4) L 10563. Not so clear but looking for push back up. No follow through.
14:14 EXIT: -3.
14:17 5) L 10565. Try again. Moving fast. Huge bounce off 580. Damn. Holding for another push. Which doesn't come.
14:26 EXIT: +5. Gave back far far too many. Inevitable that I pick the wrong one to try and hold. And get out at the bottom.
Got to stop there. Made some good points but left too many behind.
+32 from 5
+27 for the day after commission
+19 for January so far after commissions (8 days of trading)
Attachments
frugi
1
- Messages
- 1,843
- Likes
- 133
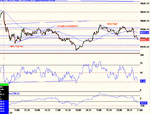
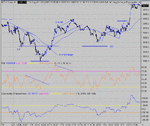
5 min/10min -The inverse H & S has a target of 10688ish YM and an encouraging volume pattern.
If the neckline around 595 does not hold on a test then perhaps we will see a wave 4 pullback to 570ish (wave 2 was a 54 point pullback over 80 mins) then a final wave 5 up of about 90 points to 660 (waves 1 & 3 both about 90 points over 100/110 mins), if the pattern maintains perfect symmetry, which they rarely do.
Just another silly analyst throwing my opinion at the market for fun - please ignore as neither of the above will happen. Don't know why but I smell a short squeeze later today. 🙂
roguetrader
Senior member
- Messages
- 2,062
- Likes
- 49
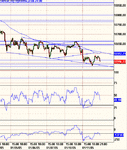
A few bullish hammers from yesterday, could be an interesting day.
So much for my guess that we were headed up today! As usual I was wrong ...
So back to channel bottom again, the S/R switch on the 10 min chart shows where the big sell off started. Looks like the bad news this morning and oil going up to $48 a barrel got the bears selling.
So back to channel bottom again, the S/R switch on the 10 min chart shows where the big sell off started. Looks like the bad news this morning and oil going up to $48 a barrel got the bears selling.
Attachments
Similar threads
- Replies
- 74
- Views
- 14K
- Replies
- 4
- Views
- 6K