Dow Intraday Charts 4-7 Jan 05

Well, a return to form of sorts I guess...

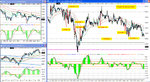
9:45 1) S 10643. Urgghhh. Instant reversal.
9:46 EXIT: -5. And another loser to start with, albeit only 5 points today.

9:55 2) S 10637. Runs down nicely but bounces off pivot. And again. Target to +11.
9:58 EXIT: +11. Well, that makes a change. The pivot turned the trend so that was a good exit.

Really choppy action around the lows at the pivot. Best left alone for a while. So I miss the break down. Great - I had a perfect signal for the short too. Just not with it yet this year.

10:32 3) S 10608. Having missed the beatiful move down to 600 I try for a second go but the bounce was hard. Straight into loss.
10:33 EXIT: -3. Oh boy. Could you read this more inaccurately? Out moments before it would have turned into another big big profit. And too cautious to chase the big bar on the breakdown.

10:50 4) L) 10594 for a quick CT. Looking for move to 610 but it needs to clear 600 first. Up and through. Then down. Not good. Will exit at 600 now.
11:00 EXIT: +5. Which was silly as now it is moving up again I should run with it. And sure enough it goes straight up to 610 and beyond without any further back slip. And I'm too annoyed to think of re-entering. Or chase the big bar after the re-tracement later. 5pts from a 70pt upmove - this is a high class demonstration of very bad judgment.

Then comes to rest on the pivot again.

12:27 5) L 10638. Looking for breakout upwards. Going up but needs to take out 50 level. Bounces straight off it first time. Tricky. Spikes through but stops hard just above and cannot take out HOD. I want to let it run but it is failing here and I'm getting nervous really quickly.
12:27 EXIT: +12. Couldn't bear it any longer. And whoosh - up it flies. Just for one bar though so can't really complain about that one.

Then endless red bar green bar chop. Horrible.

14:29 6) S 10625. For a breakdown but no follow through. Great.
14:32 EXIT: -3.

14:45 7) S 10613. Try again. Moving well. Then complete reversal.
14:47 EXIT: -1
 

Attachments

  • 20050107.jpg
    20050107.jpg
    387.3 KB · Views: 199
Many thanks to all for your comments. It has not been the start to the year I had planned on but I'll be back next week to try again. It's strange how quickly you can lose your feel for the markets when you have a break and something I absolutely must factor in for the next holiday. I wonder if this also suggests that successful trading has more to do with nuances and feel than our logical brains would have us believe?

I suspect the biggest danger is trying to get it all back too quickly (not just the actual losses but also the 'missed' profits from the week) so instead I will lower my expectations, write this week off to experience and start chipping away from Monday with as little baggage as I can (easier said than done I know).

Good weekend to all!
 
TraderTony said:
Many thanks to all for your comments. It has not been the start to the year I had planned on but I'll be back next week to try again. It's strange how quickly you can lose your feel for the markets when you have a break and something I absolutely must factor in for the next holiday. I wonder if this also suggests that successful trading has more to do with nuances and feel than our logical brains would have us believe?

I suspect the biggest danger is trying to get it all back too quickly (not just the actual losses but also the 'missed' profits from the week) so instead I will lower my expectations, write this week off to experience and start chipping away from Monday with as little baggage as I can (easier said than done I know).

Good weekend to all!
What you really discuss here is intuition.
Intuition is not the result of guesswork.
It is the result of a heightened awareness.
The obstacle is tht the conscious mind overrides what the subconscious is saying.
The subconscious mind is mor often than not absolutely right, as it contains the sum total of all our experiences. Learning to trust it and act upon what it flashes is the difficult part.
 
Bigbusiness said:
"Very obvious", if it is so easy, I am sure you can give us a live demonstration in the chat room next week. Would be good to see if you are as good as you say you are.
Hello Bigbusiness,

This is not the first time you have attempted to prod me into doing something I will not do.
It is not because I cannot, it is because I do not want to. And since you persist, I will tell you the reasons why:~

1. I am not here to give you lessons., but I am willing to point you all in the correct direction in which you should put your attention in order that you may progress, by behaving in the proper manner that the market demands from all of us.

2. I am not interested in being peppered with questions as to how and why I arrive at conclusions, to have to justify them with explanations because that is teaching, and I am not willing to teach you, because I have neither the inclination nor the time or patience any more, to deal with anonymous unknown quantities.

3. I will not allow anyone to enter my own domain of knowledge I do not myself choose and invite first, because all of this is very simple in the end analysis as it only involves the selection of choice and the execution of will, but I have learnt (because I have been taught very well by all of you not to be generous with my knowledge) to be mindful, to be very careful and to protect myself instead of trying to protect you above my own protection.

And that is for starters. ....

Neither am I interested in discussing the merits of what can be bought or sold in a mechanical sense, but I am interested in the mechanism of mind and its faculties, which is the most important aspect of trading above everything else.

I am interested in how it is that people have persistent and very real difficulties with this topic and the kind of difficulties they inadvertently bring upon themselves as a consequence of not approaching all of this appropriately, because 15% of this is mechanical and the rest is in your head, not mine. I am not you and cannot be you, therefore anything else is artificial, so I do not understand why you persist.

In the past I gave everyone a chance, only to encounter abuse and aggression. Now my posture is changed because you all have contributed to changing it, in some way or another, and I am indeed grateful for you having changed it as I realise as a consequence that to be generous and open with one's hard earned knowledge and skill in a public forum open to all and sundry is not advisable or even wise. It is best if the playing field is left at the angle of tilt at which it is.

I am sorry for you, I really am, if you want lessons and live demonstrations of trading techniques you ought to find yourself a tutor and reward him accordingly. There are several members on this website that would be pleased to render you this service, but not me, not at all, whether paid or otherwise, sorry.
 
Admin/Mods, could you check the above?

Old posts seem to be coming back as if posted more recently.

It's happening on a few threads.
 
TheBramble said:
Admin/Mods, could you check the above?

Old posts seem to be coming back as if posted more recently.

It's happening on a few threads.

So, who do you think will win the next election ?

Thatcher or Kinnock ? :cheesy:

WHAT ??
 
A bit of a tricky day on Friday IMO.

I guess any day can be an easy one if you get "in tune" with what is going on and the key is to do just that or else don't trade until you can see what is happening.

It started off looking a bit choppy, you could have gambled a short on the first peak (with RSI over 75) as it didn't reach 64 but how do you know that wasn't just a pullback with more up to come?

Looked like a bear flag but didn't trust it due to the choppy natue so far but the triangle break was worth taking, even if you waited for the pullback which I thought gave a target of 580.

No divergence on RSI to show the exit but CCI was down to -368. Once we had broke above 600 again it seemed a safe bet to go long and the next triangle break looked like it had a mouth of about 20 points.

Difficult to see the top though unless you looked at the 10 min chart and we had reached the top of the channel/flag that has been forming last few days.

It looked like a large flag was forming during the lunch break but it failed to break upwards. The divergence on RSI was saying "UP" to me but then again with a flag you normally see RSI pull back to 25ish at the end of the flag allowing room for some upside. This wasn't the case here as RSI had dropped straight back to 25ish and was now going up.

From 17:30 onwards there seemed to be a descending upper resistance line, not sure what all that was about unless I am missing something?

Justyn.
 

Attachments

  • chart.gif
    chart.gif
    21.6 KB · Views: 188
  • chart2.gif
    chart2.gif
    11.8 KB · Views: 195
When the markets doing this, its money for old rope....Every Technical trader worth their salt will be aware of the price movement & just hit the thing time after time.....Add this to price action & volume & away you go for a the mechanical side.
 

Attachments

  • snapshot-167.GIF
    snapshot-167.GIF
    207.7 KB · Views: 274
Socrates,

I wasn't asking for lessons from you or any other TTW member. I just asked a question and you have given me your answer.
 
a320, would you mind explaining you're chart a little more to some of us who are not so technical and learning to climb the rope upside down?!!
 
a320

Every Technical trader worth their salt will be aware of the price movement & just hit the thing time after time

I am not a professional trader, just someone trying to learn how to day trade the Dow.

As a "technical trader who is worth their salt" maybe you could explain your entry and exit points rather than just say that it was obvious? And if it was all so obvious what should we expect / look for on Monday?

I am sure that someone with your trading ability will be happy to prove themselves rather than turn up after the event and say how obvious it was? I will look forward to reading your reply.

Justyn.
 
justyn said:
a320

I am sure that someone with your trading ability will be happy to prove themselves rather than turn up after the event and say how obvious it was? I will look forward to reading your reply.

Justyn.

I have nothing to prove, them days have long since past... I'll let others feed their own ego's.
My post was merely to highlight what the technical traders see...The chart is self explanatory regarding the corrective moves...If its not so obvious maybe a look around the no indicators thread would help ?

& people wonder why I don't post as much

CJ

You only see what you have trained yourself to see everything else is invisible.
 
Last edited:
Since you venture to post charts of the Dow, at least it would be helpful to members if the chart displayed the correct volume, instead of repetitive bars all of the same value, or is that intentional may we ask ?
 
In connection with the above, if either preceding member with an interest in the two charts posted is capable of posting a chart of the instrument with the correct volume, I will be very happy to explain the reasons for the unfolding of this type of action and it's significance.
I will not post my own chart because it is better for either of you two to do so as it will be more meaningful to you to be able to see your own records as you will be familiar with your own displays.

There is too much nonsense bandied about this topic for my liking.
 
By the way, in an identical timeframe to the one above or similar, it's your call.

There is too much nonsense persistently bandied about this topic for my liking.
 
Socrates,

thank you for offering to explain the reasons for the day's action. I have attached my original chart with the Dow futs overlaid including volume.

Is this ok or would you like it in another format?

The most obvious thing from the chart is the volume spike at the bottom, I take it this was resistive volume that signalled the bottom/reversal?

Justyn.
 

Attachments

  • chart.gif
    chart.gif
    31.5 KB · Views: 244
That is perfect, I am running a pozzie at the moment, will deal with it later, I promise.
 
As the action has quietened down ( although a quieting down has to be regarded with alertness) I have a couple of minutes. I expect to be busy this afternoon and evening. I propose to give the full synopsis of the above after market hours US. Also I do not want this synopsis to be misunderstood and viewed in the light of my post Number 34, above, in my reply to Bigbusiness.

What I am doing is not a contradiction and I will explain why.

I am happy to unravel price and volume puzzles for members. I am not happy to be drawn into a live situation. This is because of my experience, which is that there are two dangers that in addition I am determined to avoid:~

1. I am not prepared to give ground to anyone to imply, suggest, or in any way say that live commentary constitutes investment advice.

2. In the past every live commentary I have made included a forecast, which turned out to be right, both here and on other websites and boards. But there are always people of the flat earth society mentality who will argue that the forecast is wrong or not correct or doctored or some other nonsense, and will find any excuse to knock and I am not having it.

This therefore makes anyone who has specific skills of this kind, naturally reluctant to expose himself to this kind of response.

I know it is a shame, but I am determined to protect myself instead of trying to protect anyone above myself. If you were in my shoes, you would do exactly the same.

So none of it is personal, and should not be taken as such.

Kind Regards As Usual To You All.
 
Last edited:
Socrates

I am happy to unravel price and volume puzzles for members

Much appreciated - will look forward to reading your post regarding price and volume.

Justyn.
 
justyn said:
The most obvious thing from the chart is the volume spike at the bottom, I take it this was resistive volume that signalled the bottom/reversal?

Justyn.

Hi Justyn, it's been a long time since my last posting. Hope to hear from you in the chatroom? Last time I tried, there was nobody there! I'll keep it open today:)

re. the above. Supportive volume would signify bottom/ reversal.

There were 6 volume spikes on Friday. #1 peaked just before around 10:45 (EST) and was pure S (supportive) volume. #2 came shortly after, peaked at 11:25 and was pure R (resistive). #3 peaked at 12:35 and was pure R. #4 peaked at 14:15 and was probably mixed, difficult to label. #5 was a twin peak and was pure S. #5 peaked around 14:40 and was pure S. #6 into the closed from 15:20 was probably mixed but with definite R from 15:52 onwards.

As you know, volume emphasis at the end of the day can easily be MMs "tidying up" and one can't rely on R or S volume analysis in the last half hour or so.

Overall, marketvolume.com report a small excess of resistive volume on Friday; significant build up of supportive volume looking at the whole week. They reckon we need more S volume to counteract the "hang-over" R volume from the rally since October.
However, likely retrace bounce over the next couple of days.
Interestingly, EW say the same. So it must be true:)

Graham
 
Top