You are using an out of date browser. It may not display this or other websites correctly.
You should upgrade or use an alternative browser.
You should upgrade or use an alternative browser.
Bigbusiness
Experienced member
- Messages
- 1,408
- Likes
- 23
strange day today - no divergence, indicate top or bottom. Twice, I've been up 15-20 points only for it to fall back and force me to close up 2 and 3 points respectively - grrrrr !
edit : unless u count 100 EMA as support - bounced off it 3 times now - might just go in with a long and stop at -20, as per CM's rules
edit : unless u count 100 EMA as support - bounced off it 3 times now - might just go in with a long and stop at -20, as per CM's rules
One Eyed Shark
Well-known member
- Messages
- 257
- Likes
- 13
Seems to be struggling to hold ground above 64.
Have been trading YM and so far today a MACD with standard settings has worked impeccably , calling all the tops and bottoms and giving 6 trades, all winners and all with decent points.
Haven't posted a chart before so apologies in advance if this doesn't look right.
Have been trading YM and so far today a MACD with standard settings has worked impeccably , calling all the tops and bottoms and giving 6 trades, all winners and all with decent points.
Haven't posted a chart before so apologies in advance if this doesn't look right.
Attachments
One Eyed Shark
Well-known member
- Messages
- 257
- Likes
- 13
Anmol
As with any indicator nothing works all the time, macd works for me on days like this as long as the range is not too tight, I have been using macd for a number of years and you get to learn an indicators personality in certain types of markets.
The only other indicator I now use is RSI and I am still learning from CM how this reacts in different conditions.
LOL
I thought a macd was a trending indicator not a range indicator.
it all depends what time frame you are looking at imo. i.e
one eye sharks macd working nicely short term trends but move
up a couple of time periods and it probably is still saying long??
I thought a macd was a trending indicator not a range indicator.
it all depends what time frame you are looking at imo. i.e
one eye sharks macd working nicely short term trends but move
up a couple of time periods and it probably is still saying long??
One Eyed Shark
Well-known member
- Messages
- 257
- Likes
- 13
Hooya
Anything over a 1 minute chart gives me a headache. Not often I hold a position over 30- 40 mins.
What works, works. The simpler the better.
Anything over a 1 minute chart gives me a headache. Not often I hold a position over 30- 40 mins.
What works, works. The simpler the better.
Chartman
thanks for sending me in to the thread by newtron bomb and you on the dow. It is a great education for me and other beginners like me.
To-day I went long at 10547 when price was at 100 EMA target 10580
Lack of confidence and experience make me ask am I about right in picking this entry and target.
Thanks for any replies
I got out at 10573 @14.08 looked like a small H+S on 1 min chart.
Dont know if I am right or wrong
Looks ok to me. If you are new to this, keep your stakes at below 0.1% of capital... Find 2 reasons to get onto a trade. One will be risky to start with. Taking the bounce at 100EMA was ok, the second reason would have been that the price failed to get to 32. Third reason, yesterdays resistance at 32 became today's support, also at 32. Nothing wrong with the exit reasoning. 26 points in the bag. If you are trying to trade the 100MA rules, you need a smaller stake, so that you can ride the inevitable ( almost mandatory) 20 odd points pullbacks. Study today's chart, applying the 100MA rules, and see where your exit would have been. Would you have been comfortable seeing most of your profits disappear at one point? If so, then there are two options. Fist do what you did and take what is on the table. Two, reduce your stake so that the pullbacks don't frighten you. If you find you are sweating on pullbacks( literally) then your stake is way too high!
If you want to post again, move it over to the current intraday thread..... These threads are kept in weekly archives and generally end on a Friday night, so these comments will be missed on the Newtron Bomb weekly summary.
If you want to post again, move it over to the current intraday thread..... These threads are kept in weekly archives and generally end on a Friday night, so these comments will be missed on the Newtron Bomb weekly summary.
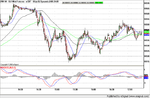
Finirama I think I see it now...16:46, 18:56 and 20:26? If so, It's incorrect. The low to 550 cancelled the first two out to invalidate the formation. Even so, it still worked. Next time it may not....
Another awkward day ( not for all) with a move to the mid channel from the lower channel. Nice step up in CCI to confirm. RSI is now showing 5 days of ND, so take care. My take is that the divergence should have come into effect by now, so maybe we have the room for a push up to the upper channel. There is still no real sign of a reversal and now we're even further away, having made the higher high.
Another awkward day ( not for all) with a move to the mid channel from the lower channel. Nice step up in CCI to confirm. RSI is now showing 5 days of ND, so take care. My take is that the divergence should have come into effect by now, so maybe we have the room for a push up to the upper channel. There is still no real sign of a reversal and now we're even further away, having made the higher high.
Attachments
Tricky day, but One Eye seems to have been on the button! Not possible with SB though... a 20 point move on the dow mostly = a losing trade. Most profitable move was taking the short term divergence at 19:40 for a long and taking the 7 waves up. Four tests of 550 and a close at HOD = up tomorrow?
Attachments
tradesmart
Experienced member
- Messages
- 1,286
- Likes
- 22
Thanks for the above CM, more 'up' I hope....... 😀
A rare day with no trades for me today! - mainly because I kept my 'long' from 10485 going from yesterday.......
A feat only achieved because I avoided watching todays action (I probably would have closed....) instead focusing on a likely positive outcome from tomorrows NF payrolls data, which the market has great hopes for.....(allegedly...!)
The weekly employment data was good today and fired the market, and I reckon this could follow through to tomorrows' data due to seasonal factors..
I figure that the futures will rise in anticipation before the data is released, and if the data is positive, a 100point rise could be on the cards...
If things go the other way my trailing stop-loss will still lock-in a good profit (....if this data disappoints, the index could dump 100 pronto imho...)
no dead certs unfortunately..... 😕