You are using an out of date browser. It may not display this or other websites correctly.
You should upgrade or use an alternative browser.
You should upgrade or use an alternative browser.

Chartman.........Many thanks for the excellent charts and analysis.
Since joining this BB two weeks ago and reading the numerous informative posts have been able to put the final piece of the jigsaw into place to produce consistant gains.
Here's my take on today..............Took the long from the triple btm
9735 at 16.15, higher low on the RSI, stop and reverse 9780
lower high RSI down to 9745 again, stop and reverse,higher low after RSI touched 20 to close again 9780 triple top. I didn't reverse here, but should have on the double top RSI then entered
long again 9755 again higher low but closed out on the dip at
19.50 at 9770 not wanting to be long into 20.00 hrs.
One of my better days. thanks. Steve.
20
Up,Down Up,Down.... retest of 9750, closing on horizontal support.Watch 9780 tomorrow for a short entry, as the up channel is broken.BUT there is a triangle in the price, and RSI channel is at support, with room for upside. 9832 will be the point to go long.
Attachments
Tracking T1 off the fall should have given you a long entry at the pullback to 9764.Track the triangle and see that 9800 made no resistance, time to breathe and have a think. T2 calculated from the triangle below 9800. The pullback at 9822 gave a target of 9835 ish..... So, when 9832 failed, that should have been an out.No? OK second chance at the pullback up to 9828- opening HOD!!! 60 odd points.
And the rest? Whipsaw city 🙁
And the rest? Whipsaw city 🙁
Attachments
Taking yesterday's suggestion of a long at 32 required more than just hitting the price. As 32 came up, divergence was well set in, making a long at 32 ish a no no. As for the rest of the day, that was a no no too. But what do you do having entered a trade either way? You have to look at the 100MA and decide, sooner or later, that it's going nowhere. Then you have to figure out at what point you are going to exit. Plenty of time to decide whether it's going to be 9800 or 9820... 🙁
Attachments
Bill
Active member
- Messages
- 160
- Likes
- 1
Yes I agree CM Friday was best left alone but real-time there does not seem to be a way of determining that. All day I was expecting a break from the range bound trade. After all the Dow strategy is about trading the big moves and not scalping.
With that in mind the overall strategy seems to be to wait for pattern break [e.g. tri, bull/bear flag etc] and confirmation before entering the trade. On a day like this it is easy to see ghosts and bearing in mind SB spread and bias [I've done some work on that see below] to maximize profit we need to be in as early as possible. Which all leads to me admitting I did make 2 mistakes [well one really] today.
I convinced myself that 9820 was going to break north at around 17:00 which was irrational. When it didn't I set my SL below 9800 [about 9793 I think] and it was taken ~7:00pm. It looked like a good place to exit since at the time I expected that if 9800 broke then there would be more downside and also there appeared to be a tri break and confirmation with target about 9780. Of course I should have either exited after the tri break or set my SL lower. Or better still not entered the trade at all. Still we live and learn!
Wasn't all bad though there were a couple of winners but not enough to cover this one loss.
RSI
Did anyone read my post from last week where I mentioned trading the RSI Osold/Obought. Again with hindsight selling at RSI 70 and buying at RSI 30 would have worked today. Didn't do it of course because it is not reliable. Another incidental observation; look at how similar the price pattern and RSI pattern are, they could almost be interchanged.
SB bias
There was some discussion on this thread last week regarding SB bias so I decided to have a closer look. It is still too early to tell but I suspect that the bias is largely a myth. I have recorded both feed from Quote.com and SB price and looked at the difference. Most of the time it is maybe one point and then not in any definable direction. The only time there was a significant bias on the Dow was when the S&P was under performing the Dow then the bias was down say 2-3 points. The thing is if the SB companies know which direction the price is going to move before we do then surely we can scrap all the TA and just watch the bias. If they know then we can also find out.
I have to say that I have only observed two days so far and will look again next week and if I find anything significant I will post it here, assuming that it is of interest to this audience.
RSI Strength
I posted an image of a RSi strength indicator earlier in the week which looked very promising. After Tuesday [FOMC day] I was just about to throw it in the bin but the bin is already full of discarded good ideas so I took another look. What it appears to show is levels of S&R. The indicator will show a down as the price reaches Res and an up as it reaches Supp. It does not tell you if the price will breach S or R. On a range bound day like Mon or Fri as the S or R is reached a nice little indicator comes in but on a trending day where S or R are breached the price moves through the indicator. I will look at it more next week.
If anyone has done any similar research in RSI strength, SB bias or has a great way of knowing when to leave the market alone I would be most interested.
Bill 🙂
Last edited:
Knowing when to leave alone is hard.... after your second loss in a row? You don't know what's round the corner, unfortunately. Therefore most are inclined to jump on board " just in case". Worse still they jump off in haste. If you get on the wrong bus, plan your exit point very carefully. If you don't have time, your position size is too big.
I'm not surprised there was no bias yesterday- the price wasn't moving, so be wary of that approach.... A long time ago, I made a killing scalping tiny moves between SB company A and SB company B. One of them had a slight delay in their price update algorithm. Long enough to see the move first on Co. A and hit the deal button on Co. B. A couple of days later, that hole was closed.
The key to bias has to be their algorithm for generating the index "cash" price. This has to be a combination ( I think) of all the indecies futures, plus volume, plus news, plus maybe a fudge factor. Figure that one out and you'll be a rich man very quickly.
Bill
Active member
- Messages
- 160
- Likes
- 1
CM
There was one bad trade but 2 maybe 3 mistakes made within that trade.
1. Entry was irrational. I would call it chasing the market. The price suddenly moves in one direction and you start to think you are missing the day's big move [sometimes it's true] so try to jump on the bandwagon without any clear TA reason why. It is easy at this stage to see possible indicators and convince yourself that they are valid [The ghosts].
2. Having made the mistake what do you do? Well put in a sensible stoploss. I chose below 9800 without thinking about it too much. If you look at Thursday's chart it is clear that support should be around 9795 rather than 9800. Also friday's chart shows support there.
3. There is also a possible tri formation with break around 18:20 and conf pb at 18:40 [Not confirmed in S&P] which would have been a good exit for a bad trade.
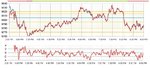
Since you mentioned SB bias, and have clearly looked into this, I thought I would show my results [Don't need much encouragement]
I did this on thursday, not friday.
Red line is Quote.com
Blue is SB price.
The chart at the bottom shows the difference. I have used a 3 min sma to take out the noise.
To be honest it does not tell me an awful lot except that 6-6:30 the bias is a little down. I take your point about trying it on a trending day though.
I must admit I feel a little uncomfortable about discussing my failures on here. You will be pushed to find anyone else doing that. Plenty of success stories, but I'm not knocking that it's very encouraging. Arguably successful trading is as much about avoiding mistakes as it is about finding opportunities so the balance ought to be 50:50. Didn't it?
Bill
There was one bad trade but 2 maybe 3 mistakes made within that trade.
1. Entry was irrational. I would call it chasing the market. The price suddenly moves in one direction and you start to think you are missing the day's big move [sometimes it's true] so try to jump on the bandwagon without any clear TA reason why. It is easy at this stage to see possible indicators and convince yourself that they are valid [The ghosts].
2. Having made the mistake what do you do? Well put in a sensible stoploss. I chose below 9800 without thinking about it too much. If you look at Thursday's chart it is clear that support should be around 9795 rather than 9800. Also friday's chart shows support there.
3. There is also a possible tri formation with break around 18:20 and conf pb at 18:40 [Not confirmed in S&P] which would have been a good exit for a bad trade.
Since you mentioned SB bias, and have clearly looked into this, I thought I would show my results [Don't need much encouragement]
I did this on thursday, not friday.
Red line is Quote.com
Blue is SB price.
The chart at the bottom shows the difference. I have used a 3 min sma to take out the noise.
To be honest it does not tell me an awful lot except that 6-6:30 the bias is a little down. I take your point about trying it on a trending day though.
I must admit I feel a little uncomfortable about discussing my failures on here. You will be pushed to find anyone else doing that. Plenty of success stories, but I'm not knocking that it's very encouraging. Arguably successful trading is as much about avoiding mistakes as it is about finding opportunities so the balance ought to be 50:50. Didn't it?
Bill
Attachments
Last edited:
Which days are most likely to be range bound?
1. Expiry friday, tends to be an erratic range day. The markets normally make a move on the Monday or Tuesday of that week to a position which will hurt the most options players and then consolidate through to the Friday.
2. The last trading day of the month is often a tight range day, presumably the big boys don't want to do too much on the last day of the month.
3. The day after a nice trend day. After a big move up or down the market will take a breather and consolidate.
Which days are most likely to trend?
1. The 1st trading day of the month. Lots of investors readjust their portfolios on the 1st day of the month and if they've all got much the same idea then well see a good trend develop through the day.
2. Mondays. Again many retail investors look at their portfolios at the weekend and make their trades on a Monday.
These are just my observations and obviously aren't certainties. Trading is about percentages and the percentage chance of the above happening is higher than random.
This Monday is both a Monday (obviously!) and the 1st trading day of the month so lets see if it is also a trend day according to the rules!
Does anyone else have any observations as to which days are likely to trend and which are likely to consolidate?
Good solid reasoning, Sid.
Bill, on your SB/Quote.com chart, are you able to chart the difference, as opposed to the overlay? Some clever excel wiz should be able to take in the data and display it as a difference... That MAY give a big edge. Get on it guys, I'm an Excel dunce.🙁
Bill, on your SB/Quote.com chart, are you able to chart the difference, as opposed to the overlay? Some clever excel wiz should be able to take in the data and display it as a difference... That MAY give a big edge. Get on it guys, I'm an Excel dunce.🙁
Bill
Active member
- Messages
- 160
- Likes
- 1
Sidinuk
Thanks for that. A great help, I'll keep a lookout.
CM
Have I misunderstood you regarding difference. The bottom chart on my last post is supposed to be the difference.
+ive SB > Quote; -ive SB < Quote
Bill
Edit
PS By the way if anyone has any other ideas that they would like investigating. Post them here. Preferably related to the Dow strategy but I'm willing to consider anything.
Last edited:
rossored
Senior member
- Messages
- 2,103
- Likes
- 56
OK, so you want to know how to eradicate "SB bias"?
Dont trade SB. Simple, really.
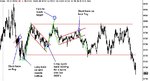
I've attached a chart (albeit a messy one) of yesterdays action on the Dow, indicating some trades. I'm not saying whether or not I took them or not, it's irrelevant to my posting.
Suffice to say this. When I take my positions - if I go long at, say, 9771 yesterday morning, I can set my stop just below the recent lows, counting on a double bottom. When the price reaches 9772, I'm in profit. If the price tanks, my 5-10 point stop takes me out for a $25-50 loss. Big deal. As the price starts to move off, you can (if you like) move your stop to breakeven plus one with the click of a mouse, and walk off and have a cup of tea for a few minutes. You are then in a no-loss situation. OK, on a few occassions you might get a point or three slippage, but its no big deal. Most of the SB companies wont allow you to run a stop on daily Dow much tighter than 30 points on entry. If you are trading direct, you can have a 1 point stop if you like. It wont do you much good, given how volatile futures can be, but you CAN do it. My stop is never more than 10 ticks, and lets face it, if your entry is correct the stoploss is completely irrelevant anyway.
So - back to the chart - look how many opportunites there were yesterday. A relatively easy 40+ points, just on the moves I've illustrated. More if you took a gamble and jumped in on the big down spike (not that I did).
The point I'm making is this : most people who are trading SB have probably got, what, £1500 in thier accounts? You can open a direct access account with that. OK, so you might take a few hits and need to top it up once or twice to start with, but why give your money to the SB companies? You can trade EVERY day, trading small moves. You don't have to sit there and think : "hmm, there is a 20-point move here, but with the `bias` and the spread, I wont be able to trade that" ( yes, I speak from experience there ). You can click the button and wait. You'll know pretty soon if you're wrong, and your stop will do the rest if your fingers aren't fast enough.
So, here's something else to click : www.interactivebrokers.com
Try it. You might like it. What the worst that could happen?
(deluge of people moaning about how futures can wipe you out now please)
If anyone has got any questions, then feel free to PM me. It took a 'chat' with another trader on here to convince me to move to direct access - he had this same "conversation" with me - but once you've done it, you'll never think about SB again imo.
RR
Dont trade SB. Simple, really.
I've attached a chart (albeit a messy one) of yesterdays action on the Dow, indicating some trades. I'm not saying whether or not I took them or not, it's irrelevant to my posting.
Suffice to say this. When I take my positions - if I go long at, say, 9771 yesterday morning, I can set my stop just below the recent lows, counting on a double bottom. When the price reaches 9772, I'm in profit. If the price tanks, my 5-10 point stop takes me out for a $25-50 loss. Big deal. As the price starts to move off, you can (if you like) move your stop to breakeven plus one with the click of a mouse, and walk off and have a cup of tea for a few minutes. You are then in a no-loss situation. OK, on a few occassions you might get a point or three slippage, but its no big deal. Most of the SB companies wont allow you to run a stop on daily Dow much tighter than 30 points on entry. If you are trading direct, you can have a 1 point stop if you like. It wont do you much good, given how volatile futures can be, but you CAN do it. My stop is never more than 10 ticks, and lets face it, if your entry is correct the stoploss is completely irrelevant anyway.
So - back to the chart - look how many opportunites there were yesterday. A relatively easy 40+ points, just on the moves I've illustrated. More if you took a gamble and jumped in on the big down spike (not that I did).
The point I'm making is this : most people who are trading SB have probably got, what, £1500 in thier accounts? You can open a direct access account with that. OK, so you might take a few hits and need to top it up once or twice to start with, but why give your money to the SB companies? You can trade EVERY day, trading small moves. You don't have to sit there and think : "hmm, there is a 20-point move here, but with the `bias` and the spread, I wont be able to trade that" ( yes, I speak from experience there ). You can click the button and wait. You'll know pretty soon if you're wrong, and your stop will do the rest if your fingers aren't fast enough.
So, here's something else to click : www.interactivebrokers.com
Try it. You might like it. What the worst that could happen?
(deluge of people moaning about how futures can wipe you out now please)
If anyone has got any questions, then feel free to PM me. It took a 'chat' with another trader on here to convince me to move to direct access - he had this same "conversation" with me - but once you've done it, you'll never think about SB again imo.
RR
Attachments
Last edited:
Bill, sorry I missed that bootom part of the chart WAS the difference.🙁
RR. You are 100% correct. There is absolutely NO doubt that trading IB is a stroll in the park compared to SB.
The other side of the coin is that there is a MINIMUM account balance . Some people just cannot reach that minimum requirement and are therefore STUCK with no alternative other than SB. If you can stand the boredom, longer term on SB is fine. One person I know has recently been creaming it on the 10 min/eod timescale. 500 points on one move, 250+ on another, just letting it tick over in the background. 30 points in the spread/bias under those conditions is neither here nor there. They do this as a background top-up to their day trading activities. A freebie if you like.
Perhaps you could post account/margin/ min account details for Dow trading, with a suitable margin for a minimum trading capital. Maybe it would help those who would like to, scrape the extra cash and go direct account.....
CM & Bill,
Another observation about Fridays' trading was the quite volatile jumps in cheap/dearness in the YM future. To be expected in a range bound market where traders are anxious trying to trade the next break-out (up or down).
CM, as I believe you mentioned somewhere that you also trade YM contracts (but also applicable to SB's as they hedge with futures and cash - whatever is cheapest), I wondered if you have/can share any experiences how these fluctuations might affect your/the Dow daytrading performance?
PS1
Once again, this thread has been of great educational value to me, both in terms of looking at DOW daytrades but also in general improving pattern recognition. Importantly, your trading rules guidelines seem to fit my personality and helps me locking in some pts.
PS2. Good to see that I am not the only 24/7 trader (joke).
Hi Guys
I have to agree with what rosso said i tried with SB and got nowhere so in the early part of the year i changed to IB i opened the account with £2200 not a fortune and took a while to get use to it as the moment the market moves your either in profit or loss no lag as with SB but you can use a tight stop never more than 10 points i got the account down to about £1500 before i had to transfer more funds as the problem i had was now i could get the price i started trading a tick chart and scalping great fun but expensive you need $2000 plus your trading money if you know what your doing then £2000 - £3000 should get you going if you haven't got the money wait till you have its worth the wait
Best regards mark
rossored
Senior member
- Messages
- 2,103
- Likes
- 56
Most of the info for margin is on the IB site but can be tricky to find:
Minimum account balance is ( I think ) around £1450. With this you will be able to trade a single mini Dow ($5 value) contract during the normal hours (0930EST to 1545EST). After 1545 IB revert to 100% margin so you would not be able to trade after this time with the absolute minimum balance.
A $5 YM contract costs $1350 to buy and maintain during the day. After 1545EST it jumps to $2700 I believe. Hence, start trading one contract, and maybe after you've doubled your opening balance you can think about trading two. One contract is roughly equivalent to a £3-a-point SB.
You do of course have to pay commissions - $2.40 PER CONTRACT - so that's $4.80 to open and close a position. Hence a one tick profit ( opening at, say 9000 and closing at 9001 ) will make you the vast sum of $0.20. And you have to pay tax on your profits. Still, as I said to my SB broker when I closed my account, I'd rather pay tax on some profits than no tax on no profits.
For what its worth, I opened my IB account with not a lot more than the minimum.
RR
I agree with IB observations. Excellent platform. I would argue that one should try to fund one's account in a manner that margin issues will not affect trading decisions.
As for commissions/costs, what I like about the Dow contract is a. small sized trades have reasonable 1or2pt bid-ask (eg .01%) and b. commissions are relative low (2x$2.4 per $49,000 is also only .01%). Combined only .02-.04%.
Even better seems to be the DAX, which commands €90,000 per contract (€25x3600) but has wider bid-ask and can jump violently. Unfortunately the opposite is the case in the Eurostoxx50 commissions (€10 x 2600).
Similar threads
- Replies
- 74
- Views
- 14K