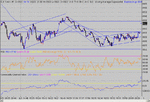
Dow Intraday charts 02/06 - 06/06

ChartMan

Legendary member
Messages
5,580
Likes
47
Yet another flying open, breaking the 10 min chart mid-uptrend resistance line and straight to T1 target after a perfect bull flag pullback. Getting in should have been straight forward, tracking/anticipating the flag. Again we have our familiar bump 3 pk ND top that fails to deliver, instead slowly continuing to develop a gentle up trend.
Four tests of 9k and then a failure signalled time for a short, the preceding tops forming a second ND 3pk top ( unusual) across 34 minutes. The resulting pullback to 892 gave a target of 8964.(T2)
8992 to 8964 gave T3 at 8936 duly met. Then on through to 8910 and a pullback to give a nice hor. resistance line.
Take note tomorrow of that line, and the one below it at 8900. From that ( 8930) , extrapolate another 70 points down to get 8860 as a support line. That doesn't look too convincing, so I'd suggest 8850 is the number...
 

Attachments

  • dow 02-06-03 1 mina.gif
    dow 02-06-03 1 mina.gif
    23.9 KB · Views: 916
10 Min chart. Failed to break 10 min res trendline, and failed at 9K to continue the Inv H&S from target to continuation. RSI dropped into O/S territory could mean a push tomorrow. Room for a possible drop to 8850 , uptrend and hor. support, then off?
 

Attachments

  • dow 02-06-03 10 mina.gif
    dow 02-06-03 10 mina.gif
    30.1 KB · Views: 828
Japan's bulls charge again

Jeff Randall, City Editor

04/18/1993

The Times of London (Copyright 1993)

DEALERS in Japanese shares are increasingly confident that Tokyo's three-year bear market is finally over.

Stockbrokers believe the Japanese government's 76 billion (Pounds) package of public investment and tax concessions, unveiled last week, will underpin the Nikkei index at about 20,000 and could give Tokyo share prices the impetus to continue their recent surge.

Kiichi Miyazawa, the prime minister, said his spending proposals should enable the country to meet its official forecast of 3.3% growth for the fiscal year ending March 1994.

Having bumped along between 16,000 and 17,000 for the first two months of 1993, the Nikkei has risen by more than 20% in six weeks. It closed on Friday at 20,297, the first time it has ended the week above the psychologically important 20,000 level for more than a year. Investment houses that called the turn have enjoyed big capital gains. Among the new bulls of Tokyo is Morgan Stanley, the Wall Street investment house. Four weeks ago, David Roche, its global equity strategist, told his firm's institutional clients to "buy" the Japanese market. "We were not in for the first 8% of the recent rise," says Roche, "and some of our clients thought we had missed the boat. But the economic factors, such as very low interest rates, are right for further progress. We shall continue to recommend being overweight in Japanese equities up to 24,000."
 
Sorry , I don't have time to do an extensive review tonight..... Just take on board the importance of channel lines as I have said before... Yesterdays estimate of 8850 looking better that 8860 put me 10 points out. :(
The other lines held good... I see the channel narrowing now to 8860/8900.
There was a major TA faiure today- can you spot it?
Even if your TA is next to nothing, using the channel lines to trade off support /resistance will provide decent profits...
 

Attachments

  • dow 03-06-03 1 mina.gif
    dow 03-06-03 1 mina.gif
    24.2 KB · Views: 784
Just as well

"There was a major TA faiure today- can you spot it?"

Continuation H&S from 18-34 to 19-12. Showed up well on ES. Didn't trade it as i stop by 5-30GMT

Les
 
the failed breakout at around 16:40 from 8930 s/r caught me out,
lost 18pts inc. the spread.
Made up a bit with 3 other trades, all small winners, finished at
-5pts.
I found it quite tough with the narrow day range, no decent targets i could see.
cheers,
neil
 
cci was v. useful today though in confirming the lows at 18:34 ish
 
I'll be paying more attention to this thread from now on. You mention watching 8900 on monday, yesterday it banged up against it like a glass ceiling before breaking through in last twenty minutes. I seem to learn better through chart examples - keep up the good work please Chartman.
 
I thought the break up at about 16.20 through 8907 thru a few recent highs was a good 'un.

Cheers
 
Charting's not an exact science - so what's ten minutes between friends.
 
Oatman,

sorry m8, could not make head or tail of yr message - I must b still pissed up this morning.... :) what Roche r u talking about?

cheers
 
Maybe I had brain failure last night. :( I was thinking along the lines that the open looked like a quick 3 pk ND top, but RSI made 3 higher highs, negating that. Clearly just a Bear Flag. Gave you all something to think about I suppose. Looks like action right now will be causing a stir :)
 
You've got a new student Chartman.I made some money today but if I'd understood what I was seeing I'd have made a darn sight more! I seem to pick things up more easily from charts so please keep up the good work.
 
Nice day for trading to targets.Confirmation of the day's range break came just after the first triangle, which broke the channel line 8927, so a nice safe long entry, to T1. From there a re-test with a mini bull flag to give T2. Then the triangle to give T3 . This was a small move of 10 points , so not too significant... Three lower lows ( just) on RSI with 3 higher highs on the price should have had you out at the top. Irregular form of 3 pk ND top....... If not, the follow on was a mini bull flag that clearly failed. Either way, you should have been out on the right side of 9000.
Then potential misery for the impatient ones with extensive sideways action for hours..... 30 points range with SB is untradable.... But then the reward. RSI develops into a great triangle . Taking any of the lows after 19:49 was minimum risk, given the narrow range and any break below 9000 would be an instant out... worth the gamble. Then the break to T4 and 120 odd points in the bag. Include in the risk assesment for an early entry is the RSI price ratio on the drops- close on 2:1 very weak, so minimal chance of a big drop.
Coming off yesterday's bottom produced a nice RS Switch that followed through into the open....
 

Attachments

  • dow 04-06-03 1 mina.gif
    dow 04-06-03 1 mina.gif
    20 KB · Views: 533
Welcome aboard Jonny. I've just realised what I said on Monday. ( I've got a terrible memory)_ :(
Room for a drop to 8850 then off...... luck again I suppose. Why else would I have chosen 8750 in the comp again? Mind you, there's 2 days to go yet.... but I somehow don't feel lucky.
 
Hi Guys is the any reason why i can not see the charts?/ I am trying to learn how to SB the dow but have failed badly so far lol oh well one day
 
Me old China Pl8, don't you read your own posts? Must have been a good drink :LOL:

Cheers
 
Top