DOW - ES Charts 02/12 - 06/12

ChartMan

Legendary member
Messages
5,580
Likes
47
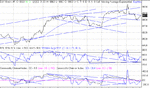
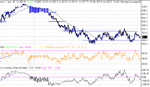
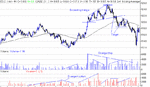
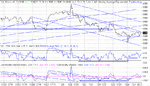
Strange day, started by pre-trading opening up the dow at something like +100, only to drop like a stone as the session went on. First test at 8900 turned straight into resistance and then dropping another 100 to test 8800. Didn't like that too much , recovering the drop to close at 63% Fib 8863.
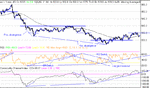
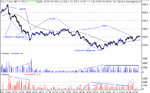
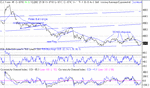
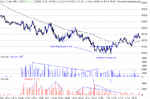
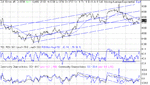
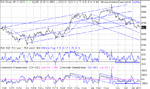
Downtrend on TA has broken and the prior RS switch has still held valid, giving an opportunity to further develop. This has developed into a weak inverse head and shoulders under the100MA. Watch this carefully . This is the logic of the situation:- IF the inv. H&S performs, we're looking at a big drop and confirmation of a continued down trend. If it fails, it will confirm that the down trend is invalid. For this confirmation we need to re-test the right shoulder at around the 100MA, break above it and drop back to the 100MA before taking off. And it will.
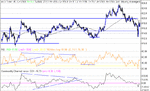
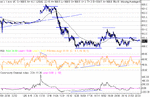
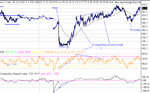
One way or the other, this looks like a big move brewing so don't go guessing. It won't take long to resolve and may even do so overnight......
As I'm typing this , ES has moved up 6 points equating to a nominal 56 points on the dow, which means we're resolving to the upside.
 

Attachments

  • dow 02-12-02.gif
    dow 02-12-02.gif
    18.8 KB · Views: 460
Couple of things to notice.... both the pos. divergence bottoms developed around the 05's and the 00's and both developing over 25 minutes or so. Clear RS and SR switch, along with two triangle breakouts made for an interesting and volatile day. Good for 30-35 points.
 

Attachments

  • es 02-12-02.gif
    es 02-12-02.gif
    16.6 KB · Views: 479
Volume chart, showing the lunchtime inactivity ( relatively).
 

Attachments

  • es 02-12-02 vol.gif
    es 02-12-02 vol.gif
    19 KB · Views: 476
Eek what a c*** up. I should have looked at the dow 1 min chart. My excuse is I don't have time to do everything :(
The "apparent" inverse H&S on the 10 Min DOW really wasn't anything like it when you look at the 1 min chart. - Basic error there- look at all timescales!!! On the 1 min chart which I'm posting tonight shows there wasn't an Inv H&S yesterday, so my comments were just utter rubbish...sorry about that. :(
It should have ready - failed bull flag followed by a potential bear flag and down.
I made up for it today in the chat room getting in some great calls, talking the down move to a target of 8727 and suggesting a turnaround. I made the comment about covering a short is NOT an open invitation to going long.... and that's how it turned out. After the bottom at 8727, there really wasn't any good entries to go long- the whipsaws all the way to the close being the proof.
 

Attachments

  • dow 03-12-02.gif
    dow 03-12-02.gif
    19.1 KB · Views: 396
Not a lot to say about today... I wish the data feed provide would get rid of those data errors that show up every Tuesday pre-trading. :(
Consolidating at the lows and down?
 

Attachments

  • es 03-12-02.gif
    es 03-12-02.gif
    18.9 KB · Views: 412
Early session saw the up tick volume steadily declining, interleaved with peaks in the downtick volume. At 16:45 , there was an uptrend slope starting in the up tick volume.This signalled the start of the bottom. Then the downtick volume went into decline forming divergence.
I have to say, that it was easier to call the action on this from the dow 1 min chart than the ES chart. BUT some of the clues came from the volume action. Maybe it's just because I am so used to seing certain things on the dow develop in a certain way. How you get there, I guess it doesn't matter, just as long as you do.
 

Attachments

  • es 03-12-02 vol.gif
    es 03-12-02 vol.gif
    19.6 KB · Views: 429
Back to looking at the 10 min for an overall view of what's happening... The four tramlines seem a reasonable fit and should therefor be a good indicator of the likely direction. Bottom line support at 8680, next channel resistance 8800 then 8900. 9080 looks a million miles away right now :( But wait...... is that an expanding triangle I see? Downside is 8450 upside 8950.....
RS switch and divergent bottom looks like up to me.
 

Attachments

  • dow 04-12-02.gif
    dow 04-12-02.gif
    23 KB · Views: 380
Plenty of 10 and 20 point mooves today- and plenty of danger...
 

Attachments

  • es 04-12-02.gif
    es 04-12-02.gif
    19 KB · Views: 351
If you're into bottom picking, you're in luck :) Following the decline from 6pm onwards, the down tick dars wer steadily increasing producing a nice trend line.The last highest peak was at 18:45 and the price continued down to 912, making a lower high on the volume bar suggesting a divergent bottom. Note it isn't confirmed until the next pullback, where the uptick volume is seen to increase and a further decrease in the down tick volume.
A different story with the expanding triangle top. You can clearly see that the down tick volumes are increasing, showing a willingness of the shorters to go short with confidence. The uptick volumes, however, are clearly not supporting the big move up. There is only one inevitable outcome, and that happened on the last major peak in the uptick volume at 20:12.
Not easy to trade the triangle as you would need 2-3 point stops. Picking the top by careful observation and taking the ride down from 925 to 918 with just over a 1 point pullback should have been a stroll in the park.
 

Attachments

  • es 04-12-02 vol.gif
    es 04-12-02 vol.gif
    17.2 KB · Views: 360
So I got it wrong again :) Still, as soon as 8700 went, there was no other way but down. It still looks divergent to me , with support at 8600. So next stop is 8450 if 8600 goes , otherwise it's wander time.
 

Attachments

  • dow 05-12-02.gif
    dow 05-12-02.gif
    25.9 KB · Views: 297
Easy ride down from the divergent top to 905, so long as you had the stomach for a 3 point stop.Even so, closing out on the pullbacks and re-entering later would still have delivered some good gains.
 

Attachments

  • es 05-12-02.gif
    es 05-12-02.gif
    18.8 KB · Views: 317
The divergence has finally taken effect, giving us the classic "V" bottom and an inverse head and shoulders. The exit point is sufficiently close to the 100MA line that I would expect it to give way quickly on Monday, heading for the target of 8700 and prior uptrend lower support line at 8750. Divergence confirmation is across the two shoulders, and a new uptrend will be confirmed with the price breaking the 100MA. A pullback to the 100MA before continuing will add strength to the move.
 

Attachments

  • dow 06-12-02.gif
    dow 06-12-02.gif
    21.5 KB · Views: 270
Strange going on....... Great trading volatility. Anyone long prior to 13:30 ( and why not?) would have got badly burned. A classic example of stay out when news comes out!! The rise form 902 to 906 must have been sooooo tempting, and no doubt those much wiser would have close before 13:30 and sat back..... just in case. And justifiably too. Still, as often happens ( and as I posted on the BB this week) bad news frequently recovers to "staus quo" and so it did, but what about that 13 point drop to death.Could your nerves and pocket stand it?
Still , a good recovery and a couple of interesting signs- the Divergent top failed to deliver a reversal- just a mere 4 point pullback to the 100MA before another push up. ( NOTE- the divergent top is a closing position, but the follow on short entry is not UNTIL the price drops through the 100MA). The closing session saw the second point of interest- the "W" bottom. We normally only see this at a true ( or sometimes false) bottom- I've never seen it at a top. Is this a sign of major strength from somewhere? We'll see next week as it pans out- make a note of this for future reference. You may not see another one for a few years. A good session for TA buffs :)
I'll check the vol. chart and see if there are any clues there......
 

Attachments

  • es 06-12-02.gif
    es 06-12-02.gif
    20.3 KB · Views: 279
Interesting volume chart. The down tick volumes just didn't count for anything. There was absolutely no interest in sell at all. Hardly surprising after the 13 point drop! So maybe it was a dead cert for the recovery.... for the opening session, average and peak volume were much higher than normal. For a change, lunchtime saw a good steady profitable move up. You can see from the volume trend lines that for the whole of this chart, the down tick slope stayed constantly negative bar the odd brief excursion, hence the failure to reverse on the divergent top. Next chart, I'll look at the closing session...
 

Attachments

  • es 06a-12-02 vol.gif
    es 06a-12-02 vol.gif
    20.8 KB · Views: 227
Post lunch rally and some decisions. The shorters tried their hand and pushed the price down to 907. Clearly the longs were all fired up to go their uptrend slope just showing the way producing good divergence. The second shot at 907 saw the shorters walk away, leaving the door open for the bulls to take over. Last part of the session sees the bulls holding over the weekend and the wimps closing out as sellers.
If I have read this right, this says up to me.
To avoid confusion, the average volume line is the average of what would be the combined volume if up and down were shown on one volume chart. It is NOT the average for each individual volume chart.
 

Attachments

  • es 06b-12-02 vol.gif
    es 06b-12-02 vol.gif
    24 KB · Views: 178
Top