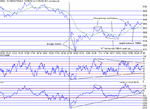
Dow Intraday charts 10/06 - 14/06

ChartMan

Legendary member
Messages
5,580
Likes
47
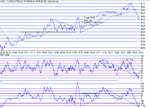
Good day today.A drop to support at the open to 9570, and then off fo a quick blip to 9640 and an equally quick drop back to support.That was followed by the formation of a bull flag, target9670, that duly performed, followed by a drop to the 100MA before continuing to make the ND top at 977, previous resistance/support being at 9706. From there it was an unexpected drop to the close at 9645, well below the expected close at around the 100 MA. Could be we're sitting on an RS switch ....
Almost forgot the tea time traders....7pm onwards had some nice gains....entry at 9670, picking the top and down for a total of around 90 to 100 points..
 

Attachments

  • 10_06_02.gif
    10_06_02.gif
    16.4 KB · Views: 491
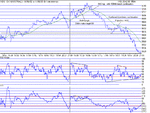
Great trading range today with some (relatively) easy trading...A run up to the top at 9757 above the 100 MA and then a drop for the rest on the day to finish at a lowly 9517, 7 points of LOD.
The bull triangle giving the break to the top failed by some 7 or so points, giving a clue to the weakness that was to follow.Earlier confirmation was by way of the top resistance line of the bull wedge becoming support, and then almost immediately going back to resistance with a pullback from the H&S.
That led the way to a 150 point drop from the top to form an inverse H&S at 9600. This "bottom" failed , by way of not penetrating the 100MA, confirming continuation of the down trend. An attemt to find support at the previous hor. value of 9607 seemed to be working, with the 100MA break, but was unfounded,only making 8 points above. That failure led to another 100 point drop to the bottom at 9510, a drop of 250 points. Although RSI shows PD, phase is confirming the move...
 

Attachments

  • 11_06_02.gif
    11_06_02.gif
    17.6 KB · Views: 471
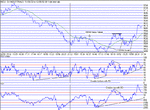
Plenty of action today, but hard to pick out the good moves as there was quite a lot of unpredictability...double tops and bottoms in evidence ( not seen those for a while). A nice 100+ point rally into the close, giving the tea time traders a nice earner. Phase on 1 min nicely positive now, and maybe a pullback tomorrow to 9564?....
 

Attachments

  • 12_06_02.gif
    12_06_02.gif
    17.8 KB · Views: 439
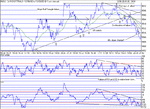
Yes, a pullback to 64 and a lot more! Yet again all the clues were there leading up to the drop. At first it seemed there may be a bull triangle developing, but as time went on, the failure signs started to appear....The top was running along 9621 with the uptrend starting at 9452 culminating at the breakdown at 9579. The first clue was the lower high at 9610...The second was the failure of the uptrend support at 9664 which is a natural support /resistance value, recently established. The third confirmation ( and things go in three's) as if it were needed, was the two bounces off the old uptrend support line that was clearly now resistance, making a clear cut SR switch. I have to own up to making a fatal error of judjement tonight, having missed the third and crucial point. I had been correctly short at 58, but was 'tricked' into going long by a sudden jump in the bias on fins just as the price broke out above the 100 MA by 5 points after what appeared to be a strong up trend off 9550 that I had correctly read as a possible support value.It was compounded by the fact that there was a small bounce up right on the 100MA...From there it was downhill all the way and I reversed the long to a short again to salvage something out of a really bad move. A hard lesson learnt. My initial belief in the short should have prevailed, but I failed to re-check the overall picture, to my cost. Apart from that, I ignored one of my most basic rules :- "if you are in the 100MA band, stay in until it breaks" In mitigation, at that point I was at -20 which is my normal stop loss out. Clearly I still need practice at shorting :)
Plenty of interesting things to learn off today's chart. Sorry I lost the faith, H. One for the book I think.
Postscript.... check out archive dow intraday on 29/04/02 for a very similar situation.
 

Attachments

  • 13_06_02.gif
    13_06_02.gif
    20.6 KB · Views: 408
Failure big time. :) Great trading ranges for the day and lots of opportunities to pick tops and bottoms. The chart speaks for itself. I had a much better trading session this evening, getting 5 out of 5, and better still, picking the divergent top at 9481 within 1 tick and going short. Had I waited just a few more seconds, it would have been perfection. Most gratifying. Got the bottom bounce off the 100MA as well, and took a few more points to the second top , and shorted again from there. The trades were taken outside of the 100MA + 20..... although I have to say I was tempted to go long on the second bounce on the 100MA at 9425. Instead, I sat back, reviewed the situation and planned my next entry.That is how I should have done it last night.....
 

Attachments

  • 14_06_02.gif
    14_06_02.gif
    16.3 KB · Views: 376
Top