You are using an out of date browser. It may not display this or other websites correctly.
You should upgrade or use an alternative browser.
You should upgrade or use an alternative browser.
Bigbusiness
Experienced member
- Messages
- 1,408
- Likes
- 23
I use the free Quotetracker software with Stockwatch real time feed. It works out at $15.99 a month. It took a bit of time to set up and the data seems be half a second behind lycos live charts at times but it is fine for my purposes. There are more expensive real-time feeds that might be a bit faster.
Here is a screen shot
http://www.s-rees.co.uk/temp/dow.GIF
and the Quotetracker website
http://www.medved.net/quotetracker/
Here is a screen shot
http://www.s-rees.co.uk/temp/dow.GIF
and the Quotetracker website
http://www.medved.net/quotetracker/
china white
Established member
- Messages
- 979
- Likes
- 12
Oatman,
hiya m8, honestly forgot what I faffed about im me own posts - classic innit.... feel a bit like Trigger from Only Fools and Horses..... 🙂
Cheers
hiya m8, honestly forgot what I faffed about im me own posts - classic innit.... feel a bit like Trigger from Only Fools and Horses..... 🙂
Cheers
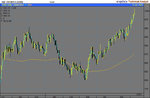
Sorry, just another quickie tonight.... Tricky start with the DOW wandering around with no conviction. Having closed above 9027, we must be looking to hold the 9K break... RS Switch was a good long call and an out on the nd top just bofore the close.
The channel dropped a bit today, but returned to broadly up... 9020 is still in there as an RS point.
The channel dropped a bit today, but returned to broadly up... 9020 is still in there as an RS point.
Attachments
here's a quick observation. When you get a nice trending day (up or down) like Wednesday then the following day is more often than not choppy as the market catches it's breath. If you have a trend following system then just take the day off and spend your profits from the day before, else you'll end up giving them all back. When I noticed this fact and felt comfortable not looking at trading for a whole day I doubled the overall return from my system. Not trading is a position when the market conditions aren't right for your particular system. It's all about probabilities, nothing else.
another thing, Mondays are usually (about 80%) good trending days. Thursdays and Fridays are the chopiest.
another thing, Mondays are usually (about 80%) good trending days. Thursdays and Fridays are the chopiest.
Bigbusiness
Experienced member
- Messages
- 1,408
- Likes
- 23
sidinuk,
An interesting observation and I agree with it in the current market. But looking back a bit, a large trend day is quite often followed by another one. There are lots of times in the past where the Dow goes up a lot one day and down a lot the next. There are also lots of times when the trend continues for several days. At the moment the Dow is in a narrow range and doesn't seem to be acting in a typical fashion.
Since the 7/4/03, I can't find a day with a range over 200 points. When the Dow breaks out of this narrow range, it might pay to trade every day again.
Pleased to hear that.
I've just got set up with IB, twiddling me thumbs for a week waiting for ££ to go through, I've watched some lovely moves go by and now I've started finding my way around the thing stops! Still it's only cost me a few $ in my impatience.
Good luck
ARRRRGH - Mombasa, not pleased to hear that. Your post appeared while I was doing mine. We were referring to similar.
Cheers
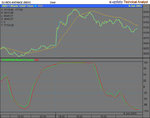
Looks like the INDU might hold on to 9100- the market Tracker suggests that the next short term move is up. ( 1min)
Lines on chart are optimised indexia short averages. Notice how they cross and the 121 av goes above the price action while the market Tracker is at +100( Thus intimating that it has a 100% chance of heading South- just wait for the confirmation from other indicators & Hey Presto!!
Lines on chart are optimised indexia short averages. Notice how they cross and the 121 av goes above the price action while the market Tracker is at +100( Thus intimating that it has a 100% chance of heading South- just wait for the confirmation from other indicators & Hey Presto!!