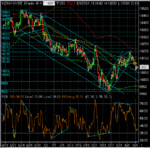
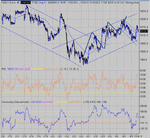
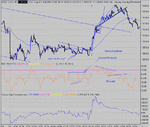
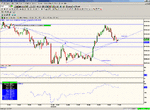
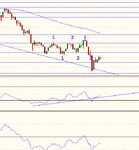
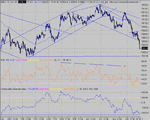
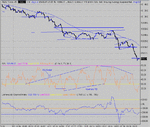
Dow Intraday charts 02/08 06/08

OK Justyn, I see what you mean. That's not to say that I agree with your thinking. I'm not saying I'm right and you are wrong either.
Bill, yes there was an SR switch. Chart attached. There are only so many things that I see in the short time that I do my charts. And I miss some important things. Just a reminder a lot of these TA things only confirm a negative, ie the RS switch is confirming the price is unlikely to go lower. It is NOT confirmation that it will rise ( although that is often the outcome).
 

Attachments

  • RS SWitch.gif
    RS SWitch.gif
    17.9 KB · Views: 284
Looks like the former resistance top downtrend channel line has become support for now, but with burgeoning oil prices, it might not hold for long if $45/barrel gets hit…….. :confused:

But a step back to $40 ish would give hope to those of us with Dow Comp entries north of 300 (hey CM – it’s not over ‘til it’s over……..!!......... ;) )

edit - 5min chart added - playing 'spot the triangle' no problem today........!?
 

Attachments

  • 04-08-04.gif
    04-08-04.gif
    27.6 KB · Views: 267
  • 04-08-04a.gif
    04-08-04a.gif
    13.3 KB · Views: 238
Last edited:
CM - can't get to chat-room - wife nagging :(.....could i post a numpty question...spotted the triangle today -no problem T1 ( 10126 )hit easily @ approx 18-50.

You say to valid triangles have 3 cycles - are you counting a cycle from the base, up to resistance slope then back to base line again...?

Many thanks

Si
 
That's right- see picky for the perfect form.
 

Attachments

  • triangles.gif
    triangles.gif
    5.5 KB · Views: 254
Confusion now as to where we're going..... Is it 5 waves up , 1 down, and back up again now?
 

Attachments

  • dow 04-08-04 10.gif
    dow 04-08-04 10.gif
    42.9 KB · Views: 266
Another tough day , until later on.... No real clue as to that breakout, save the PD shown. The triangle that Mobile Mart mentioned should be treated as a flag, giving you T1 as drawn. Notice the 5 waves up to get to the triangle. This lead me to use 075 as the base of the pole. IF it had been a straight run up from the breakout pullback at 85, then I would have used 85 as the base of the pole. Ideally, for a move to continue past T1, it needs to be reached decisively, and preferably go beyond. At this time, there will usually be another target that can be calculated. If, as today, it dithers up to T1, the chances are it won't go beyond. I had the target as between 160 and 165. so if it was going to carry on, I would have expected a small pause at 164.
OK the ND top.... 3rd peak expected at 19:08 +24 = 19:32. An out at 150 ( 19:36) is perfectly acceptable- just 10 off the top.
RS and SR switches mentioned for the benefit of Bill the latter providing confirmation of a short after the ND top.... the former coming quite late in the move.
I'm thinking of a new rule for the ND top so maybe some of you can contribute to some original work here!.
The problem is how to know when or if to take a short after an ND top. We know it is a risk in a strongly trading day ( NOT the norm) to go short on the third peak. Here is what I would suggest may be worth a look.:-
Draw a trend line from the first peak across to the trough following the second peak ( wolf wave type thing). When and if the price drops this line, go short. I have drawn this in for today, and would have worked fine with a pullback to 155 coinciding with the RS switch.
Any takers to backtest this and report back? Could be your claim to fame :cheesy:
 

Attachments

  • dow 04-08-04 1.gif
    dow 04-08-04 1.gif
    28.8 KB · Views: 304
I'm away with the family trading between outings, nappy changes etc on a very wonky dial up line so really just trying to keep my hand in.

Took the breakout from the triangle at 12:31 but exited a little prematurely on what I saw as a triple ND at 14:23 for +50.

Interesting observations on reversing on the ND CM. Night all!
 
Only one trade today, too busy with the day job!

My (novice) view on todays action:

Took a "small" short at point A on the attached 5 Min chart, purely on the basis that I didn't think it would break the resistance line. Missed the opportunity to exit near to 070, but managed to make a few points.

I noticed the reluctance to go below 070 and also the repeated bounces off the resistance line. I thought as we approached 19:00 GMT we would either see a reasonably sized move above the resistance line or below 070.

I had to pop out for food at 18:15 and made it home for 19:00 only to see the resistance line had broken and I had missed the opportunity for a long when the price rose to 160.

I later noticed that an earlier support line I had drawn seems to still be acting as support in the last few mins of trading.

And that's it! Haven't had much time today. Shame I missed the long from 18:30GMT but maybe next time :)

Justyn.
 

Attachments

  • chart.gif
    chart.gif
    45.2 KB · Views: 278
Last edited:
There's always another bus. Sometimes, five come at once. Those are the ones to catch. :cheesy:
 
Interesting long term Dow analysis, see :- http://www.polarpacific.com/Articles/Posts/dow.htm

I suppose that any bullish projections depend on the price of oil falling first (a bit like my Dow Comp entry for this week............ :( ............!)

Bigger oil slick ahead.....?
"Even if prices drop to $40 in the near term, it will do little to change the positive technical outlook," Kilduff said, adding that he believes both technical and fundamental signs point to the possibility of a price move to $50, but more likely "$48-ish, albeit briefly."
 
Last edited:
How can you miss a flag so big and obvious that it is slapping you in the face?

Well I'm first to admit that I did and I won't do it again.

I was on the wrong side, having gone long based on the divergence. Thought I had made the correct choice when 50 finally broke but must have been a false breakout of the flag which I hadn't seen at this point.

CM - is this the correct way to count a flag (see chart)?

I didn't look at the bigger picture at the time. After the event I looked at a 5 min chart and the flag was there plain as day.

Going down the pub.

Dow 1 - Justyn 0
 

Attachments

  • chart.gif
    chart.gif
    7.5 KB · Views: 254
Somebody please just shoot me....

What a balls up I made of today.

Felt uncomfortable with early downside action and sat aside as 100ema seemed too flat (but it kept going down anyway). Then jumped into a long on first small cross of 100ema/pullback at 10:50est (10101) after a big single PD but this was far too early and quickly looked horrible. Clearly, I should have used the pullback to the 100ema to join the shorts.

Stopped out for -31. Very very stupid and annoying trade as the market just went down and down and down. An entry on the RSI TLB off the 100ema would have gone 80+ points into profit before a clear reversal (see below).

Finally moved to take a short on an RSI TLB at 13:07 at 10044 but this was after a big single PD (as first trade) on the last LOD so it felt risky. I was looking for one last dip before a reversal on a 3 low PD.

Went +8 but this time appeared not to follow through and a H/S looked very likely. I'm finding that a PD/ND low/high followed by a higher low/lower high (i.e. H/S on price with divergence between the first shoulder and the head) is quite a powerful reversal - does anyone else have any thoughts on this? Anyway, worried about being caught in a reversal I closed for +4 only for it to move down again for the PD I was expecting and a possible +14 or so.

Finally got the 3 lower low PD (with an RSI TLB) at 13:41 around 10030. I didn't reverse but taking this TLB break up with a first target of the 100ema was probably a fairly low risk option for +15 or so more.

I waited for next clear RSI/CCI TLB up which was a gamble because it was back below the 100ema but on a higher low near the bottom of the consolidation area. I entered at 14:16 est (10034). It paused right at the top of the area hitting +10 with CCI above zero for first time in the day but price pulled right back to-wards entry before finally taking out the highs. Went +20 or so then pulled back to 100ema/previous and crashed right down to lows. Out at break even. Fake out.

Why the determination to go long on a day when the price cannot break cleanly above the 100ema?

One more trade - short - taken at 15:23 est at 10116 on pullback to 100 ema. Finally got one right and closed for +50 at 15:56 est.

I finished the day with +23 points from 4 trades feeling very angry with myself as I completely lost the plot for most of the day but also very relieved to have come good at the end. CM - it is a great testament to your method that someone can trade as badly as I have today and still come out ahead.
 
Tony - a profit's a profit - cheer up.......!

Seems almost inevitable now that we’re going to test our ‘new’ lower support line again with a possible double-bottom setup (assuming support around 9900 holds…..!?)

I suspected that the last test of that level 2 weeks ago didn’t give a wide enough support base when compared with the previous two bottoms……..

Hindsight………hindsight…….!

Well, at least managed to get a good short in today…….. ;)
 

Attachments

  • 05-08-04.gif
    05-08-04.gif
    21 KB · Views: 243
Tradesmart,

the chart you just posted ....

I have flags fresh in my mind - see my post above. Your chart looks a little like a flag which has just failed the third pull down and about to break out upwards through the resistance line?

Just a thought.

Justyn.
 
I agree with that view.....but there is a retrace- not what I would expect to see if the failure to reach support rule was to apply....
 
I did notice that, wasn't sure if it was significant or not. Thought I would point out what I could see, just in case it was of use.

Justyn.
 
FWIW CCI is very close to OS as is RSI . Hor support is at 9918 ish. Strangely enough, that flag in the middle at 10,040 gives a target of 9920. That suggests any move down that fails to make 9920 should /could be jumped on.
 

Attachments

  • dow 05-08-04 10.gif
    dow 05-08-04 10.gif
    34.4 KB · Views: 280
Nothing but a slide down the slippery 100MA slope... Not easy to see, but during the protracted middle flag with PD, turned itself into a bear flag. That may have been cause to cover, but not to go long.Any thoughts of a long should have been quashed when the final peak ( where I would have expected a break) failed to make 64. Close examination of the RSI swings shows no stregth in any of the up swings compared to the down swings.
The first low at 27 was confirmed as the first 3pk PD by div. volume on ES so no shame on covering there.Spot on. But how to see the final dropand get another short in. ? Not easy.
 

Attachments

  • dow 05-08-04 1.gif
    dow 05-08-04 1.gif
    27.7 KB · Views: 278
TraderTony said:
I finished the day with +23 points from 4 trades feeling very angry with myself as I completely lost the plot for most of the day but also very relieved to have come good at the end. CM - it is a great testament to your method that someone can trade as badly as I have today and still come out ahead.

This is what I am all about- not so much securing huge profits for everyone, but keeping a traders' Pot intact, even in the bad times. The huge profits will come later.....
 
Top