Dow Intraday charts 05/Jan - 09/Jan

ChartMan

Legendary member
Messages
5,580
Likes
47
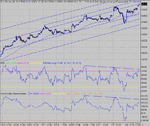
Nice break, now back to the serious stuff.... The 10 Min chart since my break has carried on up the channel from March. At one point, it did look like we were going to make a real top and a trend break, but it faded.... Except for the 2nd Jan, we have stayed firmly in channel. That day we saw a break above and below the channel, I guess due to mm's and thin volumes, trying to make a market...
Mom , as for the bull flags in 10 mins chart, I see three today.The main one has a target of 10, 570 or so... The other minor two are not really flags, more pullbacks. The difference is the bull flag should have 3 cycles, the pullbacks are totally lacking in that area.... So can we look forward to 570 tomorrow? I wouldn't bet on it. The bull flag target is relying on the gap up. Not something that one should rely on.... That doesn't mean that we won't make 570 either.
 

Attachments

  • dow 05-01-04 10.gif
    dow 05-01-04 10.gif
    30.2 KB · Views: 829
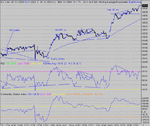
What did I see that was unusual today , that lead me to think that the Dow would go up? I saw the ES drop by 5.5 points and the Dow hardly moved at all..... I've seen the dow lead a bit, Ive seen it lag, a bit, but I've never seen it stand still , watching ES give up 50 odd dow points.... OK that's a bit of an exaggeration,maybe, but you get the gist.... Pretty much a wait and see day today. I've chopped the chart today, to illustrate a mistake by someone..... Taking the 3 pks at 505 as an ND top...( I'm not poking fun, just explaining the subtle differences in ND tops one can see that make them NOT an ND top.)
Firstly, the three peaks only spread across 21 mins, from 18:13 to 18:34. You need 25 mins to be sure.... Secondly, it's important that all three peaks make higher highs. As a side point, we'd expect some testing and re-testing at the 00's. Here we got a triple top or a micro H&S.
The next possibility is a tricky call. The first 3 peaks do not meet the minimum time, but taking 4 peaks, we get 28 mins. So you can take an exit. Now you will be looking for another entry. Short on long? Take a look at the RSI strength from 470 to 505 and compare the drops. And again from 495 to 505. Not a lot of point in looking for a short , really... So a long as the price bounces off 500 and through the 100MA.
I posted elsewhere about taking the exit on the ND top at 537. 9 times out of 10 that will be the top. Today it wasn't. The other 9 times, you'll lose 20 + points as the real top and bias takes it away from you.
If you can, take a close look at the stretched opening bull flag/RS Switch. Skim and others on the darkside pointed out an "Adam and Eve" bottom. You can just see this at 4700, with the sharp drop from 490 to 470. Why did it do that? did someone press the wrong button on ES and sell too many contracts, or was it some other bit of news /noise glitch? Either way, ignore it. I'm not interested in strange goings on that only happen once in a blue moon. You can't glean any useful information from that. This A&E bottom is rare, so don't worry about it. What was much more important ( ignoring the spike drop) was the fact that the "Eve" bottom failed to make the support trend line.
 

Attachments

  • dow 05-01-04 1.gif
    dow 05-01-04 1.gif
    24.7 KB · Views: 846
Bear Flag on the 10 min chart with target of 10,485ish, also forming right shouder of H/S????
 
Has anyone out there been able to draw any more clues from todays early price action ?

ES/S&P does not seem to give any hints either :(

Time to sit on my hands for while I think.
 
Hi Mr Shark,

I think it's forming what's known as a tight 'rectangular consolidation' between 10500/10525 and when a break from this range comes, it could be quite powerful.

This pattern reflects market indecision imho, a battle between the bulls and bears - I'll wait till I see a clean break from the range to indicate the direction to trade.

Upside potential could be a bit limited, so maybe down in the post-lunch action?!

But, as we have noticed, this bull market does not give ground easily, and generally the line of least resistance is up.... :confused:

Pass..... :eek:

edit 19.25- whipsawsville setting in? I've only had one punt today for 12 points, so I think I'll leave it at that until the tight range is resolved....
 
Last edited:
Yes, mostly consolidation and a very hard day. Sit on hand is correct. It's a favourite trading position. Practise it!
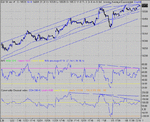
Still maintaining the central channel, and as TS nicely put it, hard going, but following the path of least resistance, which is relentlessly slowly upwards. I've forgotten what a top looks like.:( . ES Vol seems average and I can't see anything in my crystal ball to suggest a reversal. Having never witnessed such a prolonged and sustained rise, I'm not sure what to expect when the top comes.There's what vaguely resembles an ND top, but it certainly doesn't have the form of what we would expect to see on a 1 min chart, so I'll dismiss it. ON THE OTHER HAND.. If I ignore the noise ( the peak at 10,527 on the 2nd.) , then it does have the form of a bump ND top... A short entry would be around 520, but this leaves not a lot between there and potential support at 500...
 

Attachments

  • dow 06-01-04 10.gif
    dow 06-01-04 10.gif
    28.7 KB · Views: 727
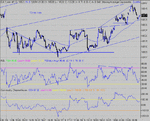
Tough day, long or short, you wouldn't have lost or won much at all, unless you succumbed to whipsaw fever, then it's a potential shirt loser.:( Even the divergences only produced a few points, barely enough to beat the bias and spread. A lucky punt at 17:30 could have netted 50 odd at best....
 

Attachments

  • dow 06-01-04 1.gif
    dow 06-01-04 1.gif
    27.1 KB · Views: 722
Is somebody somewhere having a laugh?????

5 pts. rangebound for the last half an hour :( :(

How do you trade this ??

Breakout / down 500/ 470 ?

Just checked early january 2003 and we had daily swings of 100 / 200 points , what has gone wrong. :devilish:
 
Well, this is a snapshot of one from mid-august
 

Attachments

  • spike.gif
    spike.gif
    13.6 KB · Views: 578
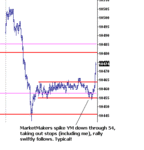
Typical sign here. Marketmakers move down through support on YM to 54, take out the stops (including me) and then it rallies off. Look carefully, you can see the exact same thing happened before. I just didnt think about it this time! LOL
 

Attachments

  • gits.gif
    gits.gif
    7.3 KB · Views: 597
Last edited:
Easy now as a retrospective, but the 'long' clue was the 'V' bottom bounce off of 10464 indicating v.strong support at that level...

not to be confused with Eve's bottom of course...... :eek:
 
And spot on 10 min lower projected channel line...
So who didn't do their homework?
 
UP :cheesy:
If this is a mini pullback, we have double confirmation of 540 target.
 
Options rollover today also,which will lead to volatility up and down the range.....or Wally Wednesday as i've heard it called by the Yanks...
 
Well, you can't keep a good index down!?

That drop to 10464 was near as damn it a 50% retracement of the recent 10385 - 10550 upleg (just to add to the clues!) so maybe that's all for the bears today?

The Nasdaq is going into orbit again after a small dip into the red, so maybe this will drag the Dow up......

Heady days for the Bulls......
 

Attachments

  • stock-bull.jpg
    stock-bull.jpg
    13 KB · Views: 484
Top