You are using an out of date browser. It may not display this or other websites correctly.
You should upgrade or use an alternative browser.
You should upgrade or use an alternative browser.
One Eyed Shark
Well-known member
- Messages
- 257
- Likes
- 13
TS my middle name has to be something I can spell, you obviously had a better education than me 😀
Beige Book can sometimes move the market so out until 7 check out this for more info
http://www.nasdaq.com/econoday/reports/US/EN/New_York/beige_book/year/2004/yearly/03/index.html[/URL]
Beige Book can sometimes move the market so out until 7 check out this for more info
http://www.nasdaq.com/econoday/reports/US/EN/New_York/beige_book/year/2004/yearly/03/index.html[/URL]
tradesmart
Experienced member
- Messages
- 1,286
- Likes
- 22
Straight from the book........
The U.S. economy continued to expand in February with modest gains in employment and prices, the Federal Reserve said Wednesday in its Beige Book report on the economy.
Growth was variously described as "moderate," "firm," "sound" and "accelerating" in the Fed's 12 regional districts.
Employment has been growing slowly in most Federal Reserve districts," the Beige Book said.
Wages were growing slowly, while employee benefit costs were increasing faster.
Retail prices were "level or modestly increasing" while "commodity prices have moved up more noticeably."
Consumer spending was higher in 11 of 12 districts, with only St. Louis reporting lower sales. Manufacturing output also increased in 11 districts, with Cleveland reporting steady production.
The Beige Book was compiled by the professional staff at the Federal Reserve Bank of Philadelphia from thousands of contacts with businesses and others in each district. The report is not the views of the Federal Open Market Committee, which meets in 13 days to consider changes to monetary policy.
Perhaps they ought to have called it the 'magnolia' or 'pea-green' book (slightly less inspiring than beige..... 😆 )
does this mean buy or sell? - watching closely.... 😎
Now on 1min chart 3 peaks with RSI Neg divergence BUT could it be a bull flag. On 5min chart it seems to me that we are working away overbought condition.
Also not that RSI reached for 1st time since Monday's top a 70+ reading. This bounce seems to have more strength.
Are we going to test late yesterdays' rel high of 10622?
Also not that RSI reached for 1st time since Monday's top a 70+ reading. This bounce seems to have more strength.
Are we going to test late yesterdays' rel high of 10622?
tradesmart
Experienced member
- Messages
- 1,286
- Likes
- 22
bgold - I'm seeing strength too - (so far) - it might well have a crack at 620+ today........
RSI and CCI bearing up and the price has bounced off the 100ma..
RSI and CCI bearing up and the price has bounced off the 100ma..
tradesmart
Experienced member
- Messages
- 1,286
- Likes
- 22
Anmol – as posted above, but RSI has now apparently bottomed mid-range, and as CCI indicates, we are still above the rising 100ma and making a higher low now……
If it makes a decisive run north, it’ll do it in the last ½ hr imho…..
You know the old saying “amateurs rule the open, and professionals rule the close” (or words to that effect….. 😕 )
If it makes a decisive run north, it’ll do it in the last ½ hr imho…..
You know the old saying “amateurs rule the open, and professionals rule the close” (or words to that effect….. 😕 )
tradesmart
Experienced member
- Messages
- 1,286
- Likes
- 22
ah well, now we see what the professionals had in store........
another bull trap as yesterday night....... 😡
anmol - hope you kept that short running........
another bull trap as yesterday night....... 😡
anmol - hope you kept that short running........
i am afraid i cancelled that short - no worries.
Just a question for everyone. Situations like the breakout at 631pm, it seemed destined to fly, considering the range bound action before hand. I was tempted to double my stake because I was confident it would go up a few points.
My plan was to get rid of half the stake as soon as it slowed down - does anybody place trades like this or am I asking for a punishment
You can, but you really do have to be sure of the move. Having a well defined target, from a triangle or a flag will help. Be sure that the target is not going to violate a 10 min support/resistance value... The best place to add is on pullbacks...
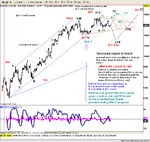
OK , So I was wrong about the triangle. But it's not what you would expect to see, with too much action/inactivity between the peaks and troughs.....
Anmo there was a classic opportunity to add after that triangle broke... At the point where the second, much smaller triangle broke, it had a target of 82. As the price passed through that, that is where to add, having a target from the bigger triangle of 610.
Anmo there was a classic opportunity to add after that triangle broke... At the point where the second, much smaller triangle broke, it had a target of 82. As the price passed through that, that is where to add, having a target from the bigger triangle of 610.
Attachments
tradesmart
Experienced member
- Messages
- 1,286
- Likes
- 22
Things were getting cloudy....Now I see it. :cheesy:
This seems a tad oblique CM, but you seem pleased about it, so can only assume that the outlook is bullish, and may have positive overtones for your Dow Comp entry this week.....(I hope so 'cos I'm in the same ballpark......... 😆 :cheesy🙂
hmm well looking at Chartmans 20min picture of the dow it says to me weve topped out @ 750 sold off @ 700, found support @550 but failed to hold 600, so as it stands we are nearer to the sell off than we are bull rally, i'll be looking for weakness between 610/40 tops ndx looking for tops @ 1474 in first 45 mins. or looking for strength bottom @ 1458/60 zone upside 82/84
i still feel 10550 break is probable rather than 10750 on the dow next 1/3 sessions
jd
i still feel 10550 break is probable rather than 10750 on the dow next 1/3 sessions
jd
tradesmart
Experienced member
- Messages
- 1,286
- Likes
- 22
Long @ 565 - 600 here we come....(and then the rest..... 😉)
Similar threads
- Replies
- 1
- Views
- 2K