Dow Intraday charts 01/Mar - 05/Mar

TS - been trying to figure out what went wrong :(

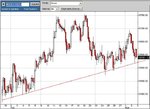
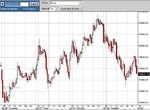
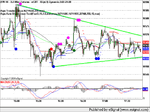
Went long on the PD on 1 min, but that didn't wok out. However looking at the 5 min chart the PD didn't appear until the last leg down.

Also, the final 'V' was indicated by the hammer candle on the 1 min and a less obvious one on 5 min.

And, also been browsing the ES thread and noted China's comment re trend days. Probably a bad idea to go long against the trend based on RSI divergence - maybe we should be looking for stronger signals like 'V' bottoms or 5 min stuff to confirm.

Still find it hard to figure out trend / non-trend days but ES thread has woken me up a bit. Any thoughts CM?

Edit - CM, I know - Divergence is not an excuse to reverse etc ....
 
Oh yeh - it also bounced off the 60 min. And, a nice h&s on 10 with that little bounce at the end forming the right shoulder - thx for that Skim from the ES thread.
 

Attachments

  • image1.jpg
    image1.jpg
    66.7 KB · Views: 365
H&S.

If I was holding overnight, I'd be short based on the h&s.

However, Daily chart shows we're close to 50 SMA so maybe a breach before a bounce.

Course, that would also breach the 60 min :(
 

Attachments

  • image1.jpg
    image1.jpg
    72.6 KB · Views: 389
Last edited:
Mom – I didn’t expect a reversal downtrend day after yesterday’s solid uptrend, and probably would have been right, but the ‘bad news’ from Mr G put a spanner in the works :mad: .

I was expecting a sideways consolidation near the highs…..

Bailed out of first two longs (average 606) at 612 when RSI was weak and price didn’t even make 100ma, rolling over at 615 ish….things looked negative….

Both longs were entered on PD as well, so just goes to show that it can let you down when it’s determined to tank on bad news…

Long at 570 was entered on the ‘v’ bottom which seemed fairly decisive to me……….

I vary stops according to how ‘wrong’ I think I am, but mostly stick to 10-15points; most of my entries are off well defined ND/PD and prior S/R, so I don’t normally see red for very long or have to pull trades.

Very occasionally, I move stops to stay in the hunt and average down/up, but adding to a losing position is plainly dodgy, and I only do it if I am very confident of retracement to profit.

Anyway – as a ‘beer money’ investor, I’m never in deep enough to take a serious hit…….. ;)
 
TS - yup, that's wot I expected too :(

My main criteria now is how to recognise trend \ non-trend days now - crack that and things should get much easier.
 
Mom . Always worth a look at the ES threads and Skim in particular as her take on waves is a good lesson. 5 waves down was the key. At your long on PD at 607, reasoning was OK, but as you say, PD is not an excuse to go long.... It's a 99% reversal, but with no guarantees for how long. So the answer is take them, but be ready to jump ship if need be...
I thought up or sideways , like TS , but the gap down on open and CCI 200 peak from yesterday was a good enough clue to stay short, or take extra care with longs. RS switch on price and way off -200 on CCI looks good for the Bears. :(
 

Attachments

  • dow 02-03-04 10.gif
    dow 02-03-04 10.gif
    26 KB · Views: 357
A short all the way down to the PD at 607.... with 3 possible entries on the pullback to resistance after the triangle drop out.
Just remember that most PD's /ND's are "equi-distant". This one was well biased to the left, so should have been treated with care. Unfortunately, ES showed a bow off bottom here so tempted a long... A check on RSI strength should have told you that the pull backs were just that- and weak too. The real bottom ,as we all found, was at 570. easy with hindsight, but TS was spot on. Was it the equi-distant PD? ES showed a clear 5 legs down too.....
The 10 min chart doesn't bode well for the bulls...
 

Attachments

  • dow 02-03-04 1.gif
    dow 02-03-04 1.gif
    23.5 KB · Views: 342
no position today so far - that 10 min h&s is kinda stalling - divergence on both 5 min & 1 min & bouncing along 60 min trendline and daily 50 SMA.

Hesistant to go long 'cos China's indices watch list all -ve apart from SOX - not sure whether this is a down trend say or not.
 
Mom, I’m long at 555 for a bit of bounce to maybe 575-590 ish, and take it from there…….

PD developing on 10min chart in support…….(we hope.... :confused: )

You have to speculate to accumulate etc etc.......... ;)
 
Probably premature to be so bold, but this has got 600 written all over it............(imho)

(but don't quote me on that....... :confused: )

and this is certainly not intended as investment advice.... ;)
 
TS - where do u get 600 from then?

I'm thinking that dbl top at 580 calls it a day for longs :(
 
Think you are right on the triangle anmol, though the lunchtime lull could spoil the pattern, either way it has a potential of a 40 pt move.................those were the days :D
 
TS just wondering if the blow off volume on es at 3:35 was one of the reasons you entered long. With hindsight i realised afterwards that 550-540 ish was good support on the 60min chart.
 
My name is not Isoceles, but I'm seeing a triangle.......

Thought - if Isoceles were in this game, he'd be cleaning up... :eek:

Anmol, entry at 555 was made on the basis of a smidge of PD and prior support level and was closed at 577 – best to just scalp on sideways days imho and try to catch any break out…….

Mom - Triangle (?) target suggests 630, so maybe 600 is a bit conservative….?!

Was thinking that the d/t at 580 was just short term intraday resistance, but maybe proved wrong...

Maybe bears are seeing a target of 510, so keeping a tight S/L on all long trades......
 
Last edited:
Watching YM but this looks to have slopey sides to me, saying that I have been trading since 7.00am
 

Attachments

  • triangle.jpg.png
    triangle.jpg.png
    69.8 KB · Views: 370
Just had a look to see that the BEIGE book is due at 7pm, does anybody know the signicance of that or what it is.

Thanks
 
OES - is your middle name Isoceles.........?! :cheesy:

and did someone mention 600 earlier?........nice guess (no more sophisticated than that....... ;) )

anmol - the beige book is the FEDS statement on economic conditions I believe (correct me if I'm wrong anyone.....)
 
Top