You are using an out of date browser. It may not display this or other websites correctly.
You should upgrade or use an alternative browser.
You should upgrade or use an alternative browser.
Pat494
Legendary member
- Messages
- 14,614
- Likes
- 1,588
robster970
Guest Author
- Messages
- 4,567
- Likes
- 1,390
1220
1179errrr right !
Will have to treat it as an outlier !
🙂
oiltrader81
Junior member
- Messages
- 37
- Likes
- 0
i think the price will remain where it is with minor fluctuations so the range should be 1230 - 1240
there are no other market movers expected until the end of the year so i don't think there will large movements outside the aforementioned range
there are no other market movers expected until the end of the year so i don't think there will large movements outside the aforementioned range
robster970
Guest Author
- Messages
- 4,567
- Likes
- 1,390
I don't believe this Pat - this might be right on the nose. There's no volume or volatility to drive it anywhere either today.........
Pat494
Legendary member
- Messages
- 14,614
- Likes
- 1,588
I don't believe this Pat - this might be right on the nose. There's no volume or volatility to drive it anywhere either today.........
Sheer genius
🙂
update 6.31 pm
but just a mo isatrader predicted 1240, so he is currently ahead !!
:eek
Last edited:
wackypete2
Legendary member
- Messages
- 10,211
- Likes
- 2,058
I'm going to start a new thread where I predict the S&P value for he next minute all day long...that way even if I'm wrong 400+ times a day it always looks like I was very close!
geez...
Peter
geez...
Peter
Pat494
Legendary member
- Messages
- 14,614
- Likes
- 1,588
I'm going to start a new thread where I predict the S&P value for he next minute all day long...that way even if I'm wrong 400+ times a day it always looks like I was very close!
geez...
Peter
Came in an honourable 2nd. Not too bad. 🙂
Pat494
Legendary member
- Messages
- 14,614
- Likes
- 1,588
For Week Ending Friday 10th December at 1240.4
WINNERS
Pat 494.........12
hwsteele .......6
Gaffs............6
wackypete .....4
N. Rothschild ..2
dpinpon ........1
Elitejets ........1
luckyd 1976 ....1
robster970.....1
isatrader.......1
A new member is on the leader board, so good one isatrader
:clap:
WINNERS
Pat 494.........12
hwsteele .......6
Gaffs............6
wackypete .....4
N. Rothschild ..2
dpinpon ........1
Elitejets ........1
luckyd 1976 ....1
robster970.....1
isatrader.......1
A new member is on the leader board, so good one isatrader
:clap:
robster970
Guest Author
- Messages
- 4,567
- Likes
- 1,390
Chinese interest rate rise, thin volumes as it moves towards Christmas, COT increasingly net short so I reckon this is all for hedging against underlying equities.
1255 - only kidding Pat.........
1240 again.
1255 - only kidding Pat.........
1240 again.
isatrader
Senior member
- Messages
- 2,965
- Likes
- 136
1248
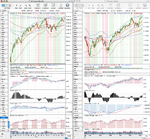
Have attached my charts to show why I’m still bullish. Have gone for the upper channel line as my target as think the weekly close above the 61.8% Fibonacci line from the last three years is a bullish sign for the intermediate term. However, the pop in volume on the daily chart and then decline towards the end of the week is concerning for me that it might be a false breakout.
Have attached my charts to show why I’m still bullish. Have gone for the upper channel line as my target as think the weekly close above the 61.8% Fibonacci line from the last three years is a bullish sign for the intermediate term. However, the pop in volume on the daily chart and then decline towards the end of the week is concerning for me that it might be a false breakout.
Attachments
TRADEFUTURES
Member
- Messages
- 68
- Likes
- 7
1275
Similar threads
- Replies
- 64
- Views
- 572K
- Replies
- 873
- Views
- 353K
- Replies
- 1K
- Views
- 193K
- Replies
- 219
- Views
- 43K
P
- Replies
- 2K
- Views
- 234K
P