Trading ES (Q1 2004)

Tick action

China

How did you read the 2.15 pivot. Just had a quick look at the tick and came up with the following.
 

Attachments

  • dow 5min227.png
    dow 5min227.png
    57.7 KB · Views: 369
17/02 ES

I like this chart. Volume seems to pick the tops and MACD was giving warning not to go mad on the longs.
 

Attachments

  • dow 5min228.png
    dow 5min228.png
    137.8 KB · Views: 330
TickQ

I have been told many times that the TickQ was not worth bothering with. I like to have it open on my monitor and use it as a confirming signal. If both the Tick and TickQ are acting in the same way, then the move should have more conviction. Todays TickQ looks weaker than the Tick. The TickQ also stopped me going long at 15.20 on the signal receivecd from Tick.
 

Attachments

  • dow 5min229.png
    dow 5min229.png
    44.3 KB · Views: 329
late action 17-02

stoploss

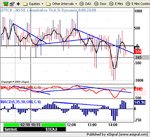
i did take short at 15:00 on tick neg div which did not deliver much did it. 2.25 pts in the bag overall on a cr*p day. there r just days when u r better off going to the beach and having caipirinhas and churrasco with yr girlfriend than trading. perfect example.

in hindsight :D the clue was: spx up next to 10 pts, a non-trend day at all time pivots, with no signs of reversal. short above upper pivot is a good call but the alternative is just jibbering about. something u cant do much about :cry:
 

Attachments

  • tick1702.jpg
    tick1702.jpg
    34.6 KB · Views: 286
another 2 pts opening hour range :((( "Droga!" as they say in Brasil :)

Stoploss - it is an open Q whether u shud take MACD signal or the histogramme for the purposes of detecting a divaergence. I'd say strong divs display divergence in both, weaker ones come out in signal OR histogramme. But again this is a Q to quants not traders :)
 
Possible inverse head and shoulders on the 10 min chart.....with target of 1,174???
 

Attachments

  • inverseh&s.bmp
    1.3 MB · Views: 159
only if it breaks 1158 going up. If it breaks 1152 going down, then its a failed Inverse H&S. As I sitting on shorts, this is my preferred option !!!
regards,
 
Agreed.

i would have taken a long on the failed retest of the low around 17.15ish

R u short from the open or yesterdays 1,159??
 
I have entered short several times in the last few days. Most are in loss. I have a small profit on one. I need about 1150 to break even. If that never happens I'll end up kicking the cat and swearing that I'll never hold on to a losing position again. However, when the US market finally comes back down to earth I'll be laughing !!
regards,
 
Sorry, too busy to reply in detail, but that head and shoulders is much clearer on the Dow 10 min chart. That's the one I'm tracking, and trading at the mo.
regards
 
Tick 18/2

China

Am I over symplying things do you think. It does seem to work.
 

Attachments

  • dow 5min230.png
    dow 5min230.png
    60.7 KB · Views: 265
Looking at the Dow and S&P 1 min candlestick charts, they could be forming bear flags. If so, there may be another sprint downwards before the close.
regards
 
Top