Trading ES (Q1 2004)

Thanks for advice. Semi-log was still on. ooops. Also used closing numbers. OHLC/4 makes the picture very similar. thanks
 
bgold

No probs. One more thing. Do you notice how the second V made by the big W does not exceed the first V. On this occasion I view it as base building at support in the Tick before the push up. This theory was discussed before on related threads. It seems to work for me. I am not sure if it has been agreed that this is an accepted way to view the Tick.

I now have three set ups which seem to work:

2 point counter trend scalps when the price is extended from the 100 EMA and when the tick makes a W/M pattern. One minute chart set up.

Continuation of trend when the price is at the 20 or 40 EMA and when the Tick makes a W/M patten. 5 minute chart set up.

Reverse of trend entry after a sustained divergence on 1 and 5 minute charts.

All these set ups need to be assessed on their own merits. Careful consideration has to be given to the market internals and how the price is moving. ie A inverse H&S in price and a positive divergence in the Tick complement each other.
 
Guys, does anbody know when the quadruple witching takes place today. I am aware that options on indices (edit) are taken out prior to the open, but not familiar with the others.
 
Last edited:
Gartley in full effect? Closed and going long in expectation of pullback to 1,118ish?? RSI confirms majorily oversold
 
A - stock optiions formally expire tomorrow saturday, but all option pricing software takes Friday as expiry as thez no trading on sat. Stock option closing spot is therefore last print of fri.
 
1100 cash

my take here is that 1100 is crucial not only psychologically :D it is 50% fib of the latest parabolic run, and even more importantly, it IS the current lower bound of the inside Andrew's pitchfork which HAS NOT BEEN violated over the whole course of this "bull run"
 

Attachments

  • s&p 500 index (cboe)- 60 minute.jpg
    s&p 500 index (cboe)- 60 minute.jpg
    69.6 KB · Views: 274
China,

Totally agree..it also where the 100ema is sitting on the day chart....if crossed then perhaps confirmation of the beginning of a new down trend???....maybe the jobs data will decide it either way?
 

Attachments

  • untitled.gif
    untitled.gif
    59 KB · Views: 278
Tick

bgold, as requested m8

(a). MACD divergence and rising tick. Price making triangle.

(b). The move up to the high of the day with the Tick giving a premature short signal at 11.15EST for a 2 pointer but you would have probably ended at break even at best. The high of the day was signalled by rising tick lows and support in price. You could have faded the high in the Tick but I have not tried that yet. The 12.30 EST down move was a continuation of B but this move was really drawn out and tedious.

(c). You have a double botton in tick and MACD for a small scalp.

(d). Price made LH and Tick, and MACD made double top. On the 1 min chart we also had a H&S.

On the way down, the slow MACD was beneath the fast MACD all the. I use this as a indicator of the strength of any move. You would have shorted any pull backs.

I hope this helps.
 
Next step, no charts

I want to get away from reading charts and just start looking at price action. Not sure if I can do it but would like to give it a decent try.

Well got to start somewhere, so I have decided to look at the Tick on a 1 minute basis to see if it will give me any pointers. It has only been the first day but I am finding it very encouraging.

This is what I have so far.
 

Attachments

  • dow 5min313.png
    dow 5min313.png
    68.9 KB · Views: 216
Tick 1 minute

Tick 1 minute was interesting. It seems to work well with the 5 minute chart when the price is extended from the 20 ma. Also, it picked the days bottom when the ma made an inverse H&S pattern.

Going to add it to my list of strategies as a scalping and trend exiting tool. I also found it a good sentiment indicator however you need to take a step back as if you watch it to closely, it will probably make you over trade.
 

Attachments

  • dow 5min314.png
    dow 5min314.png
    87.1 KB · Views: 318
1 minute ES and MACD signals

I have incorporated the 1 minute chart in my trading set up. I like to look at all time frames but I home in on the 1, 5 and 10 for my intra day plays. When these time frames are in sync, the set up is even stronger.

The below chart is a 1 minute with MACD 5 35 10 line and volume.
I use candles on this set up because imho give more clues than bars on short term momentum moves. On five and ten's, I flip flop between bars and candles. Bars are good in spotting price patterns and candles for identifying sentiment. I have studied bar set ups but I understand candles more.

On the below chart, if you ignore volume (I don't recommend you do ignore volume) for the sake of simplicity. What I am looking at is divergence between price and MACD blue line. For the majority of the session, The MACD and Price have been in gear. The two green lines indicate a divergence were you could have entered long.

I am having a problem trying to understand the two aqua arrows.
On the first one, the MACD and price made a HH but not a HOD. The subsequent move down was not very smooth as it tried to reverse at 11.17EST. My guess is that as the prior move was a HH, punters out there were looking for a long at the pull back. You can see what I mean by the fib number were it tried to reverse. The subsequent move down after it failed took out all the longs.

On the second one, the MACD and Price made a LL. Therefore, the momentum was all to the down side so any retracement was seen as a shorting opportunity.
 

Attachments

  • dow 5min318.png
    dow 5min318.png
    101.8 KB · Views: 312
SL, your posts are very educational (at least for me).
I have a combined 5min $TICK and $TRIN running but thusfar can't say the signals give me great confidence. Interested to see your/a review of the chart of today?

Keen to learn more and hear how you trade the signals. Perhaps at Saturdays' meet?
Thanks
 
Andy,

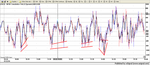
With regards to the first one. imho, it was a decent long set-up on both the YM and ES (although 1098.5 was the top of yesterdays value area - so perhaps not quite so perfect an ES set-up). The issue with any long entry at that point was the relative weakness of the NQ (compare the position of ES, NQ and YM against their opening range to see what I mean). For any trade, particularly one where you are expecting new highs or lows (and in this case where it would be expecting the ES and YM opening range to be taken out), YM, ES and NQ all have to be making a decent move from the same relative position of strength or weakness (imho of course).

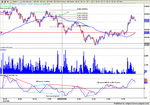
With regards to the seond one, I guess you are right. I found it a difficult one. For me, 1093.5 (ES) and 10038-10042 (YM) was a spot I was looking for a potential long. Once again the relative weakness of the NQ scuppered that plan, with 1381.5-1382.5 providing the perfect NQ short when it retraced back to there.

Seemd to me it was never going to be a "clean" day because the indices were slightly out of sync, any strenth in the YM being made up for by weakness in the NQ, with ES just sitting in the middle.

Before the open, I was anticipating that 10038-42 (YM), 1093.5-94.5 (ES) and 1381.5-82.5 (NQ) would all get "hit" at around the same time for the mother of a long. Lack of "sync" between them kind of scuppered that plan though.
 
bgold

I have only been trading for about a year and successfully only recently. I started using Tick divergence back in November (thank you China) so not that long ago really.

What I did is looked at one technique at the time and tried to understand how it works. Then once I understood how it worked, I added another layer. The 1 minute chart with macd is just an example of this. I will post a chart of the 5 min tick at market close. Things will get clearer the more you persist with it. If I can do it, anyone can m8.
 
Top