Trading ES (Q1 2004)

Skim,
Any chance of a short thesis on stepped tops/bottoms (seriously).

Just out of interest have you thought of drawing a regression line through the 1110/1145 area and xtracting parallels and comparing them with your neckline - does this make any sense?
 
Regression lines may make sense to some, but it's far too complicated for my little pea brain. I like the simple stuff. Although I do admit to having used an odd paralled line on occasions, but that is just to add weight to a horizontal support.

The stepped tops and bottoms are exactly that - stepped. My take on it is that with each break of the previous high the breakout traders pile in, the big boys snap up the shorts, and down she goes! They can only do this three times before they are rumbled, by which time they have sufficient volume to ride a nice long short. [edit: LOL - I think I mean a lengthy short]

This is one very good reason why it is not a good idea to trade breakouts, as the pros fade the breakout to create the step.
 
Gartley

Hi,all
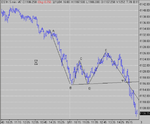
Anyone like to comment on this? I can't say that I traded it but was watching it form and attempted an early entry at the first pullback from 24.75 - I thought I was late but still tried to get in on the short from 23.0, and got stopped out! Should have waited for it to reach 25ish I suppose.
Anyway, am I seeing things or is this a valid pattern? Sorry I don't have the flash charting proggie - I have to do the calcs manually, but it all seems in proportion to me and DE was over 127% of CD to confirm the entry point. The target was reached albeit with a nasty retracement. Then it just flew through which apparently can happen with these!
More lessons learned. :LOL:
Cheers
Quercus
 

Attachments

  • screenshot002.png
    screenshot002.png
    71.2 KB · Views: 343
Last edited:
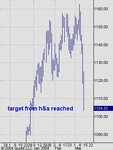
The target for the head & shoulders I posted above, has just been reached.

ES Daily chart:
 

Attachments

  • cme-es04m- daily.jpg
    cme-es04m- daily.jpg
    22.8 KB · Views: 328
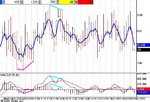
Another lesson dished out by the market to a newbie.
Thought I'd gone long at 1056 est, however after about 1/2 hour
realised no record of the trade in my 'executed orders' window.
4 hours on and 6pts plus missed I am still waiting for D4F's promised call to explain what went wrong.
IB here we come!
( Just to rub it in Tick neg div called the top and a decent retrace)
 

Attachments

  • es12mar04.jpg
    es12mar04.jpg
    30.1 KB · Views: 264
The afternoon Ticj

Hi Hamps

Good luck with steal for free. :(

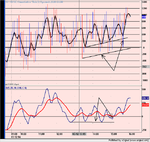
I was trying to suss out the direction of the afternoon session.

My make on the upside break can be seen in the support in the MACD of Tick and the rising bottoms in the MA and Tick.

I use to hate triangles but gettiing more to grips with them now.
 

Attachments

  • dow 5min295.png
    dow 5min295.png
    116.6 KB · Views: 308
Adam&Eve?

good to be back - missed u all :cheesy:

well 1st observation - if it is an Adam&Eve's bottom, then Eve's bottom has got quite a gap - excuse me language :)
 

Attachments

  • cme-es04m- 60 minute.jpg
    cme-es04m- 60 minute.jpg
    57.3 KB · Views: 241
Doesn't look like one to me. The Adam bit needs to be a sharp down and sharp up, and that one is a sharp down and dawdle up.
 
Bit of droop on adams part... :eek: :cheesy:

CNBC has been going on about....how we've had 3 consecutive days last week in which the closing TRIN was > 2.35, which has not happened since the 1950's... in which a bottom was put in :idea:

Any thoughts you indicator users on here :?: :cheesy:

CJ
 
agreed skim - u probably r8

amazing what hap'd in the world since i left for the uncivilised world :) some brasilian papers r openly saying now those bastids know terror can change the governments to their favour..... one goes as far as saying they won this round..... btw when is our election day in the UK? :(
 
2nd test of "holy grail" on 60 min - 20 ema - see my previous chart. bulls need a quick panic drop below 1100 and a close above 20 ema/60 min imo
 
http://groups.msn.com/KhalsasPad

a320 have a look at this site. The trader managing it has done extensive research into trin. For today according to his trin method he is expecting the gap to be filled and then into negative territory also.

Only joined the group yesterday but there seems to be some interesting stuff.

HTH
 
Hi China,

Hoep u had a nice time...

Got problems with a spike down on Sierra Charts so have to work of steal 4 free charts...i agree....if 1106 fails then down to 1100.
 
thank u lad/lassies - REALLY good time. amazing what i've seen. BUT - Amazon is such a huge continent that to really get to know it u perhaps need 20 yrs...... :)
 
btw - on SPX cash 1099 is 50% fib of the "parabolic" run since Nov 20th. + psychological sup => dont think we'll take it out on this try :)
 
Good to have u back China - u sure that the events of the past cpl weeks had nuffin 2 do with u being away :)

Ammol - good link to Khalsa's site - I remember him posting on hemscott a long time ago - one of the few posters there who were ok.
 
Top