Account Update
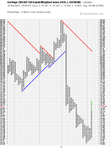
I had a surprisingly good week this week with my active trades. My swing trades in Heritage Oil and Britvic both did well and I closed them in my target zone. My breakout trade on GKN trade fared less well and was dragged down with the broader market turmoil. I however started to get more bullish on Thursday as I thought it was all getting a bit over done about the supposed Saudi day of rage. It seemed like that's what the market was focusing on so my plan was to go long on Friday if it failed to materalise, as the market had fallen to to key support at the 50 day EMA. So the Japan quake happened early on Friday and there was blanket news coverage of it, so the Saudi day of rage was glossed over as not a lot was happening with it. So I decided to long at lunchtime as the fear that had caused the decline wasn't there anymore so I thought it would be prudent to get in my S&P 500 trade before the US opened. I only opened a small position risking 0.16%, but I plan to add to the position to get up to my full 0.5% trade size on the first pullback if it looks like it is going higher still. i.e that it's just a pullback and not another leg down.
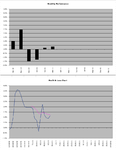
Performance
Closed Positions
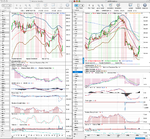
Heritage Oil Rolling Spread: 8.53% (Account P/L: 0.29%)
Britvic Rolling Spread: 3.53% (Account P/L: 0.16%)
Open positions
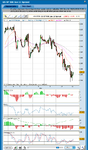
GKN Plc Rolling Spread: -5.58% (Account P/L: -0.29%)
US SP 500 Jun 11 Spread: 1.03% (Account P/L: 0.16%)
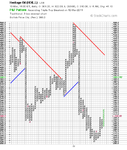
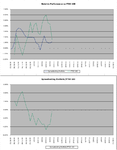
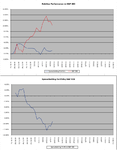
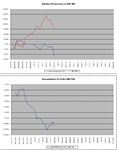
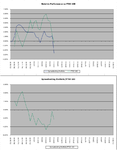
Relative performance against the indexes was good this week. I outperfrmed both the S&P 500 and the FTSE 100 which both made loses whereas I made a small gain. If you look at the relative performance charts you'll see that I'm almost back even with the FTSE since October but there's still a bit of ground to make up vs the S&P 500.
My SB Account
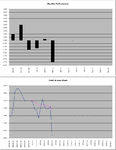
Week: 0.28%
YTD: -0.77%
S&P 500
Week: -1.28%
YTD: 3.71%
FTSE 100
Week: -2.70%
YTD: -1.21%
I've got a bullish stance on the S&P 500 this week, but I'm more neutral on the European markets so I'm considering a pairs trade to hedge myself against the volatility by going long the S&P 500 and shorting the FTSE 100 as the FTSE continues to under perform the S&P 500. I'm not sure if I'll do this or not yet as I need to calculate if it's worthwhile or not.
My long term ISA account however didn't fare so well this week, and took a -5.51% hit (-£380), which shows the downside of being more correlated to the stock market than I used to be. Weeks like last week used to be hard to deal with, but I barely look at the long term account more than once a day now days and know that draw downs are part and parcel of investing/trading long term. The goal for me is outperform the market and make a good return.
I was a bit early on my Antofagasta entry as it fell a further 10% last week, but it had a good bounce Friday at support after some capitulation selling last week. So I think we might have put a bottom in on that now. Randgold was the big drag for me last week after some panic selling on rumours sent it sharply lower to 4500 level. I'm still at 20% cash in my ISA so I've got some capacity for a new position, which will most likely be Palladium which I'm watching currently and have an entry target around the 650 level.
Anyway, that's enough for now as I'm going off topic with my longer term stuff. Below are the usual charts and trades spreadsheet for my SB account.
Have a good week