Re: More breadth indicators
Isa,
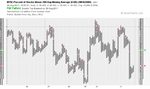
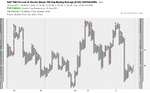
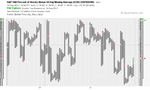
I find it interesting that you and I use many of the same instruments and have read many of the same books and seem to look up to many of the same traders (Dr. Elder in particular). However, we seem to differ in our view of the future here. I also look at $NYHL but mine says that there has YET to be a BUY signal. In fact it gave a rather strong SELL signal back in early Aug. It (according to my charts) is now around the 0 line (+59 today) and it will fluctuate between -100 and +100. If you compare this with historical values you will notice that after a strong move up or down a correction causes this indicator to fluctuate around the 0 line + or - 100. By my charts ONLY when it has gone above +100 has it been a good BUY signal. When below -100 a good SELL signal. All the strong trends may retrace to the -100 to +100 range but will always fail at the extreme of this range unless a new trend has developed. Look at the down move in 2008 as an example. There were numerous crosses above the 0 line during the downtrend when there as a rally before a further drop below -100 and worsening downtrend.
Like you I am currently long the market and long silver but I am only expecting this market rally to be short lived and probably will turn down in the next few days (in my opinion). I would not get to married to the long side here. Obviously this could change as the charts develop.
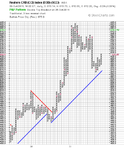
Since you like Dr. Elder,...look at the weekly MACD and see there is NOTHING bullish about that.
Also, what is your method for entry and exits? I have looked at many of your trades and they seem a bit random. Could you clarify some of your methods?
Thanks,...and good luck.
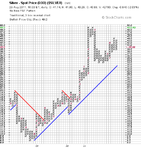
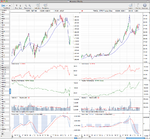
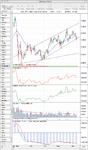
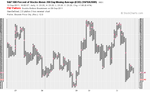
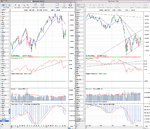
Hi eegozi, thanks for the feedback. I think however, you misread my previous post a little bit. I don't think that the New Highs New Lows chart is on a buy signal, but merely that it was showing a divergence to the price action in the market as the second move down in it was much shallower compared to the S&P 500 price which got much closer to the early August low. So I view this as positive sign in the short term, but I agree with you that the New Highs New Lows chart is looking more bearish than bullish at the moment. However, I prefer to look at all the market breadth charts, not just one, and view them together to get a picture of what is happening, which as a group is currently bullish. Also, I'm working on the thesis that we are currently in later stages of a long term Elliott wave 4 that was extended because of the various news events in early August. So by that theory I want to get long into the 5th wave which if it is a similar timescale to the previous waves will last for around 9 months or more.
I've read a large amount of trading books and methods and over the years and I've experimented with lots of the standard indicators like the MACD, RSI etc. But I've found like many others I suspect that they are mostly unreliable, so I don't use them for my buying decisions anymore. So whether MACD looks bearish at the moment doesn't really matter to me as I don't give it much weight in my analysis.
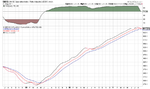
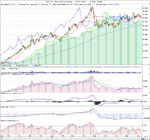
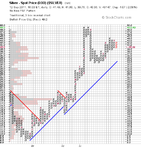
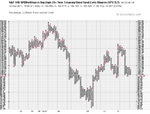
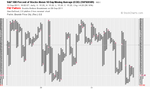
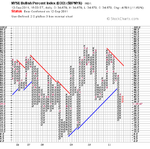
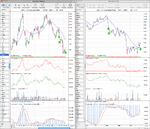
The authors that I value the most for long term trades are Stan Weinstein and Tom Dorsey. Alexander Elder and Kerry Loworn's methods I find more useful for shorter term trades. Weinstein's stage analysis forms a big part of my entry and exit method now days and has simplified my trading massively as I just look at a chart and can see which stage it is in and so can make a decision whether it's is worth looking at more in-depth. Tom Dorsey's point and figure methods are the key though I think as when they are applied to the market breadth charts like the NYSE percentage of stocks that are above their 200 day moving average and NYSE Bullish Percent Index, they give you a very clear picture of what is happening in the whole market on an equal weighted basis. 1 stock, 1 vote as he says. Whereas indexes like the S&P 500 are cap weighted so some stocks have a lot more votes than others and can hold the market up when the internals are telling you differently.
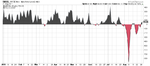
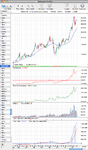
So my main method now is to buy my long term positions when the market breadth indicators are below 30%, by which I mean $BPNYA, $NYA200R and $NYA50R (their symbols on stockcharts.com if you don't know them). Which if you look back through the historical data on them is almost always the best time to buy a long term position IMO. I give these breadth indicators the most weighting in my long term view and look at the various others I've mentioned before to aid my timing.
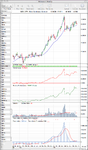
I'm not worried about being too early as my plan was to buy some positions on the initial down move and to buy more as the breadth indicators moved onto buy signals. This down move could take months to play out yet, but even if you don't agree with my timing, I'm following my plan that's taken me almost 5 years to develop. So I'm going stick with it through all the noise as it's kept me on the right path so far this year as it got me out of stocks and into bonds starting in late April, so I made a nice 5% profit through the summer while the markets tanked 20% or so and I'm currently only down a few percent for the year due to my timing on my nickel trade being a bit early at the start of this month.
🙂