isa's long term trading journal

2010 Trades Review

I’ve been working hard on learning point and figure charts the last few days and another trader from this site has been helping me with it and he manually built a one hour GBP/USD P&F chart from scratch and I’ve been updating it and trying to learn as I do. Point and figure is something that I think will be very useful for my long term trading once I get the hang of it. Anyway that’s slowed down my trades review. Am up to number eight for the year; so half way through now.

This next trade was a scale in into my previous silver trade which had been open for a month and was moving up after retesting the downtrend line support.

Trade No 48

Ticker: PHAG (ETFS Physical Silver)

Entry
Entry Date: 27/4/10
Offer Price: £11.95 ($18.01 @ FX rate 1.5070)
Amount: 83 Shares
Entry Commission: £7.00
Stamp Duty: £0.00
Total: £998.75

rValue Zone: Above
Entry Grade: 46% of days range

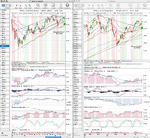
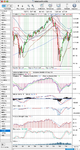
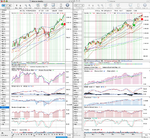
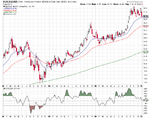
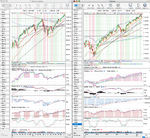
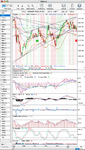
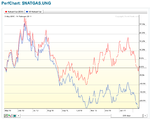
Entry Analysis – see 1st chart
Price has broken out of the downtrend and retested the downtrend support line. Is now looking to make a new weekly closing high for the year. Technicals aren’t showing any divergences and have room to the upside. The entry point looks good from the chart. My entry grade was only 46% of the days range, so could have been better.

Exit
Exit Date: 26/8/10
Bid Price: £12.04 ($18.72 @ FX rate 1.5547)
Amount: 83 Shares
Exit Commission: £0.00
Total: £999.39

Profit/Loss: £0.64
Percentage Gain/Loss: 0.06% (3.23% in dollars)

Exit Grade: 0.08% of days range
Daily Keltner Channel Captured: 11%
Trade Grade: C

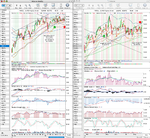
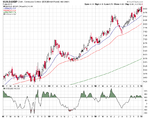
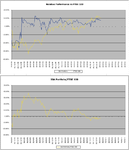
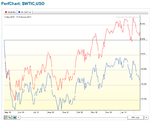
Exit Analysis – see 2nd chart
The price topped a few weeks after I bought and fell into a range between $17 and $19 for four months. Price action was choppy with frequent violent down days which made me nervous of the position. I decided to exit when the price made a sharp move up for a few days near the end of August as silver looked to be forming a 2 year double top pattern. So I closed the trade.

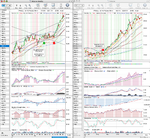
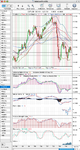
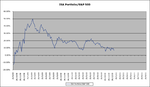
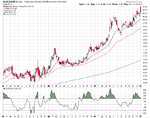
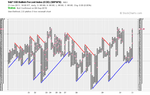
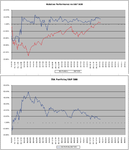
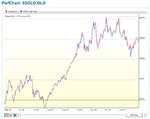
Follow up Analysis – see 3rd chart
As you can see from the follow-up chart. The day I sold was basically the beginning of silvers huge rally that continues today. Holding the position would have produced around a 66% gain, but I managed to get a whopping 0.06% of that. Is even more stupid when I look back on it now as September is usually such a great month for silver and I always aim to have a position on before September starts.

Lessons from this trade
Stick to the plan. Generally, I should to use the weekly safezone stop loss as my guide to look for an exit point on these trades. Instead I used the if in doubt get out method. A very bad trade.

The charts of the trade are attached below.
 

Attachments

  • PHAG_Entry_27-4-10.png
    PHAG_Entry_27-4-10.png
    150 KB · Views: 233
  • PHAG_Exit_26-8-10.png
    PHAG_Exit_26-8-10.png
    146.9 KB · Views: 198
  • PHAG_Followup_29-12-10.png
    PHAG_Followup_29-12-10.png
    138.4 KB · Views: 216
A Profitable 2011?

2010 was flat year for me profit wise, finishing the year up just 0.98% compared to 2009 in which I made a reasonable 10.77% profit. On the positive side I think I’ve learnt a lot over the last year and have managed to bring the draw downs much more under control with my biggest monthly loss at -3.34% in January 2010. I started to use some relative performance charts during the year and could see that I was trading inversely with the S&P 500. So I did some changes in the portfolio in October, November which have managed to change the relationship to be more in line with the general market.

So my aim this year is make 12%+ and limit the monthly draw downs to below 3%.

Attached below is my equity curve, trades spreadsheet, performance charts and the monthly S&P 500 chart and the monthly GBP/USD chart.
 

Attachments

  • ISA_Spreadsheet_31-12-10.png
    ISA_Spreadsheet_31-12-10.png
    75.4 KB · Views: 192
  • Equity-Curve_31-12-10.png
    Equity-Curve_31-12-10.png
    59.4 KB · Views: 202
  • Relative-vs-SP500_31-12-10.png
    Relative-vs-SP500_31-12-10.png
    27.1 KB · Views: 210
  • SP500_Monthly_31-12-10.png
    SP500_Monthly_31-12-10.png
    74.9 KB · Views: 210
  • GBPUSD_Monthly_31-12-10.png
    GBPUSD_Monthly_31-12-10.png
    70.3 KB · Views: 190
Re: ANTO – Entry

Ticker: ANTO
Entry Date: 7/12/10
Amount: 64 Shares
Entry Price: £15.22845
Commission: £12.50
Stamp Duty: £4.87
Total: £991.99

Stop Loss: £13.62
Target: £18.28

Entry Grade: 35%
(Calculation: High-Entry price/High-Low) Entry Grade above 50% is my target

Antofagasta has had an impressive run and today broke out to a new high. My entry in this is a breakout play.

I decided to take my small profit on Antofagasta (ANTO) today to reduce my risk after the market started to sell off sharply from the initial bounce up in the morning. My thinking is that the professionals pushed the market through the highs yesterday in the US and this morning in the UK to run the buy orders above the market in order to get the liquidity to sell their larger positions and lock in the profits they have in them. This might be wrong, but it looks likely to me, so I’m protecting my portfolio. I chose to close Antofagasta instead of Vedanta from the mining stocks in my portfolio because even though it’s been relatively stronger, I opened it later, so it looks more likely to turn into a losing position for me than Vedanta which is up 10% still.

Closing Trade

Ticker: ANTO (Antofagasta)

Exit Date: 4/1/11
Bid Price: £16.21125
Amount: 64 Shares
Exit Commission: £12.50
Total: £1025.02

Profit/Loss: £33.03
Percentage Gain/Loss: 3.33% (6.43% not including fees)

Exit Grade: 8.7% of the days range
Daily Keltner Channel Captured: 34%

Below is the charts
 

Attachments

  • ANTO_Exit_4-1-11.png
    ANTO_Exit_4-1-11.png
    133.8 KB · Views: 203
Weekend Update

It’s been down week for the account. It lost -1.72% for the week vs the S&P 500’s gain of 1.10%. I think this is due to the fact that my account is focused in commodities and commodities related stocks, which had a worse week than the overall market. The position in Antofagasta (ANTO) which I closed on Tuesday 4th appears to have been the right call. As it’s sold off fairly heavily by around 10% since then. So it would have been have stopped out at break-even for the trade if I hadn’t closed it. So I’m pleased that I did. Vedanta (VED) on the other hand has outperformed as I’d hoped this week. I believe this is due to the year long consolidation it’s already had, whereas ANTO had been in an upward trend since the summer. So I’m hopeful the 10% profit I currently have in VED will be a sufficient buffer for me to hold onto the position through this downturn. Randgold Resources (RRS) has also underperformed since October 10, and January/February are seasonally strong periods for Gold in the last 10 years on average, so I’m hopeful that the consolidation in Gold over the last few months will have worked off some of the excesses in that market, as it’s been in a fairly tight range since October. Although it’s still 8% above the 200 day moving average.

Earnings season begins again this week with Alcoa, so I’m going to stay in a protective mode for a while to see how the market reacts to the various companies earnings. As the downside risk feels greater than the upside to me at the moment. I recently read The New Market Wizards by Jack D. Schwager which was published in the 90s. He interviewed Victor Sperandeo who said the following: "I found that market price movements are like people – they have statistically significant life-expectancy profiles that can be used to measure risk exposure. For example, the median extent for an intermediate swing in the DOW during a bull market is 20 percent. This doesn’t mean that when the market is up 20 percent, it’s going to top; sometimes it will top earlier, sometimes later. However, what it does mean is that when the market is up more than 20 percent, the odds for further appreciation begin to decline significantly. Thus, if the market has been up more than 20 percent and you begin to see other evidence of a possible top, it’s important to pay close attention to that information."
I think that’s a really good bit of research, that although is 20 years out of date is still likely to be relevant today. The DOW is up around 23% since the low in July so I’m going to be on the look out for signs of a top.

US Economic Data – the week ahead

Wednesday
Import and Export Prices
EIA Petroleum Status Report
Beige Book
Treasury Budget

Thursday
International Trade*
Producer Price Index*
Jobless Claims*

Friday
Consumer Price Index*
Retail Sales*
Industrial Production*
Consumer Sentiment
Business Inventories

*most important
 

Attachments

  • Equity-Curve_7-1-11.png
    Equity-Curve_7-1-11.png
    14.8 KB · Views: 196
  • Relative-vs-SP500_7-1-11.png
    Relative-vs-SP500_7-1-11.png
    16.2 KB · Views: 215
  • Relative-Ratio_7-1-11.png
    Relative-Ratio_7-1-11.png
    11.7 KB · Views: 196
Gold in Dollars, Pounds and Euros

I thought it would interesting to view Gold in different currencies. It’s been in a range in dollars since October, but in pounds and euros it’s still close to it’s highs and has been moving up steadily. None are particularly overextended from their short term moving average, so the breakdown being talking about might not come.
 

Attachments

  • sc-3.png
    sc-3.png
    28.5 KB · Views: 205
  • sc-8.png
    sc-8.png
    29.1 KB · Views: 207
  • sc-7.png
    sc-7.png
    28 KB · Views: 195
Hi, we spoke in your spreadbetting thread.

Sorry to interrupt your flow, but I wonder if I may ask you some general questions about trading stocks and shares in ISAs? (I haven't seen many threads on T2W about ISAs).

I've had an OEIC fund based ISA with Fidelity for a number of years. Although they are a respectable company, and although I was aware the particular funds I was in were conservative ones, the results have been disappointing, to say the least. I suspect the fees may be eating into any growth there may have been. Anyway, now having some trading experience (via spread-betting), I had wondered whether I might be able to transfer some of this experience back to a stocks-and-shares based ISA.

I had naively expected that, as ISAs are aimed at the smallish investor, things would be arranged such that the fees were modest. From what you have described, that doesn't seem to be the case!

Still, I will continue with my question: let's say I continue with my existing ISA to the end of the tax year, and then put it on hold, I will be free to open up a new S&S (not funds-based) in the next tax year.

How does one go about opening up a S&S ISA for individual shares? Are there "share supermarkets" like the "funds supermarkets" like Fidelity? Or do some fund supermarkets allow you to deal in individual shares as well as funds (Fidelity don't seem to).

If you prefer, just point me to a website where I can mostly easily find (reasonably unbiased!) information about this sort of stuff, rather than take up your valuable time.

Thanks in advance.

http://www.h-l.co.uk/
 
Thanks Barjon.

Since posting the question, I did some digging, and realise that what I want is a self-select ISA, some of which allow funds of various types, as well as individual shares.


I've worked out that dividend income can be automatically re-invested (if required), but a question on this:

Has that dividend income already been taxed at source, so in a sense, you aren't really benefitting from it being within an ISA (from the dividend point of view, although if the re-invested shares gain in value, you are protected from CGT)?

I ask this, because my wife inherited some shares a while back, outside of an ISA naturally. She learned that the dividend had been paid net of tax, and as she doesn't pay income tax, she enquired whether she could reclaim it. It turned out that she couldn't, as it's not strictly-speaking income tax that has been paid, but ... whatever the tax on dividends is called, technically.

So I wondered whether the same might apply for individual shares held within an ISA, since if it's the dividend-issuing firm that is paying the tax at source, it doesn't necessarily know whether the shares are held in an ISA or not, and just pays the tax willy-nilly. still have to pay commission on the re-purchase, stamp-duty, and then there is a management fee for holding the shares.

So it's not necessarily obvious that it's worth the bother, unless at least you are saving the tax on the dividend, unless you are fairly sure of making a capital gain.
 
OK, I think I can now answer my own question: Dividends aren't strictly speaking paid net of tax (or rather tax on dividends is not, strictly-speaking, paid at source), rather a 10% "tax credit" is issued by the company, and this is true of shares in or outside an ISA.

There is a bit more to it than that, but basically the answer to my question is that you wouldn't gain anything as far as dividends are concerned by having it in an ISA.
 
Last edited:
mike

you only pay the tax deducted at source which is 10% so you won't pay the higher rates if your income is beyond basic rate level.

management fee is peanuts really, 0.5% , capped at £200 a year with HL for example, and you surely expect a capital gain :)

jon
 
Hi, we spoke in your spreadbetting thread.

Sorry to interrupt your flow, but I wonder if I may ask you some general questions about trading stocks and shares in ISAs? (I haven't seen many threads on T2W about ISAs).

I've had an OEIC fund based ISA with Fidelity for a number of years. Although they are a respectable company, and although I was aware the particular funds I was in were conservative ones, the results have been disappointing, to say the least. I suspect the fees may be eating into any growth there may have been. Anyway, now having some trading experience (via spread-betting), I had wondered whether I might be able to transfer some of this experience back to a stocks-and-shares based ISA.

I had naively expected that, as ISAs are aimed at the smallish investor, things would be arranged such that the fees were modest. From what you have described, that doesn't seem to be the case!

Still, I will continue with my question: let's say I continue with my existing ISA to the end of the tax year, and then put it on hold, I will be free to open up a new S&S (not funds-based) in the next tax year.

How does one go about opening up a S&S ISA for individual shares? Are there "share supermarkets" like the "funds supermarkets" like Fidelity? Or do some fund supermarkets allow you to deal in individual shares as well as funds (Fidelity don't seem to).

If you prefer, just point me to a website where I can mostly easily find (reasonably unbiased!) information about this sort of stuff, rather than take up your valuable time.

Thanks in advance.

Hi montmorencyt2w. No worries about responding in my journal. I’m happy for people to ask questions, make comments and tell me where I’m going wrong etc.

With regards to the question about whether your spread betting experience is transferable to a Stocks and Shares ISA. I would say a most definite yes. However, due to the fees (£12.50 per side at my provider Selftrade) you have to do a number of things:
1. Trade infrequently – Create a portfolio. This could be a range of stocks, ETFs, bonds, treasuries or just all ETFs, or just all stocks. Whatever your preference really and try not to buy and sell them too often. I currently have a target of 30%+ gain before I want to sell, but I find it hard to stick to at times.
2. Trade a minimum size of £1000 as the fees of £12.50 per side mean that you start at -2.5% at that size. Obviously this is less pronounced the larger you trade, so at £2000 you start at -1.25% and at £3000 you start at -0.83% etc.
3. You need to consider the bid/ask spread of the product or stock you are trading. The more illiquid the product the worse the bid/ask spread. I try to aim for a bid/ask spread of less than 0.5%. If you don’t have level 2 data you can work it out by dividing them by each other.
4. UK stocks have to pay stamp duty of 0.5% when you purchase them, so an extra fee. This is not the case for ETFs which are exempt from stamp duty.
Take a look at my opening post and look at the trades spreadsheet as it shows the breakdown of all the costs of each trade.

I do think ISAs are aimed at smallish investors as the majority of people will just buy something and hold it for ages. So the fees are less of a problem. There is an inquiry into this at the moment I believe and I think they’ve stated that fees will be coming down in line with other countries in the near future.

How does one go about opening up a S&S ISA for individual shares? Are there "share supermarkets" like the "funds supermarkets" like Fidelity? Or do some fund supermarkets allow you to deal in individual shares as well as funds (Fidelity don't seem to).

It is easy to open a Shares ISA. I have been with LloydsTSB, Etrade, TD Waterhouse and Selftrade. Moving between them is the problem area. So pick wisely as it takes 1 to 3 months to move an account. My preference is Selftrade. They charge £12.50 per trade and an annual fee of £35 + VAT, but you get 3 free trades in August when they debit the annual fee. Here's the link http://www.selftrade.co.uk/services/personal-dealing/shares-isa.php
I had problems with Etrade and TD Waterhouse which I’ve mentioned earlier in the journal.

Hope that helps. Am happy to answer anymore questions or you can private message me if you like.

Cheers
 
Weekend Update

A reasonable performance for the account this week gaining 1.25% from last weeks close. It was a volatile week though and which started down a bit before recovering through the week. Relative performance vs the S&P 500 was -0.39% and vs the FTSE 100 was 1.27%. So it underperformed the S&P 500 but outperformed the FTSE 100. The relative performance spread has flattened out since the major portfolio re-balancing in October/November last year and now has a range of 3 to 4%. Which isn’t too bad I think, as I only have 4 stocks at the moment and the FTSE and S&P have 100 and 500 stocks, so I expect my portfolio to be more volatile.

I’m still looking to get into an oil stock in February during the seasonal low period, but the Oil spot price needs to have correction first which normally happens in late January, early February. So I’ll be on the lookout for a good buying opportunity if it happens.

Attached below is the weekly profit and loss chart and the relative performance charts vs the S&P 500 and the FTSE 100.

US Economic Data – the week ahead

Monday
US Holiday: Martin Luther King Jr. Day – US Markets Closed

Tuesday
Empire State Manufacturing Survey
Treasury International Capital
Housing Market Index

Wednesday
Housing Starts*

Thursday
Jobless Claims*
Existing Home Sales*
Philadelphia Fed Survey*
EIA Petroleum Status Report

*most important
 

Attachments

  • Relative-vs-FTSE_14-1-11.png
    Relative-vs-FTSE_14-1-11.png
    27.9 KB · Views: 190
  • Relative-vs-SP500_14-1-11.png
    Relative-vs-SP500_14-1-11.png
    27.7 KB · Views: 209
  • ISA-Equity-Curve_14-1-11.png
    ISA-Equity-Curve_14-1-11.png
    14.8 KB · Views: 191
Last edited:
Weekend Update

A more volatile end to the week for the account which finished down -1.09% since last weeks close. Relative performance vs the S&P 500 was -0.41% and vs the FTSE 100 was +0.80%. So I underperformed the S&P 500, but outperformed the FTSE 100 again this week.

I’ve still got around 19% of my account in cash after selling Antofagasta at the start of the year and there’s a possibility that this could get bigger as I have a stop loss set at break even on Vedanta Resources. Which is only around 5% away after this weeks price movements. So I’m hopeful that the announcement on Friday that the copper margins are being lowered at the CME will give base metals stocks a boost, but miners are a volatile sector and if the market starts to sell off then they will definitely take a hit.

Nickel continues to outperform copper and is approaching it’s previous high just above the $12 level. So there will be some resistance there, but I’m confident in it as I believe it’s approaching a seasonal strong period and is a long way from being overbought on the weekly charts. I however need to do a detailed study on it as I only have the last 5 years to go on.

Randgold Resources is still the laggard of my portfolio and is now at the 5000 level. I think a measured move of the double top gives a price objective down to the 4500 level area, and also the increase in gold margins again on Friday at the CME will put further pressure on the short term speculators.

Oil is entering it’s seasonal low period, I expect a further sell off in oil short term, so I’m considering taking the loss I have in the OILW ETF and then am looking to open a position in one of the oil stocks that is showing relative strength.

Performance
ISA Weekly: -1.09%
ISA YTD: -1.58%

S&P 500 Weekly: -0.76%
S&P 500 YTD: +2.04%

FTSE 100 Weekly: -1.76%
FTSE 100 YTD: -0.06%

US Economic Data – the week ahead
Early focus will be on Wednesday's policy statement from the Fed

Tuesday
S&P Case-Shiller HPI
Consumer Confidence*

Wednesday
New Home Sales*
EIA Petroleum Status Report
FOMC Meeting Announcement*

Thursday
Durable Goods Orders*
Jobless Claims*
Pending Home Sales Index*

Friday
GDP*
Employment Cost Index
Consumer Sentiment

*most important

Looks like a very busy week of economic data

Attached are the weekly charts. I’ve included the S&P 500 chart and the S&P 500 Bullish Percent Index which shows that over 80% of S&P 500 stocks are on a point and figure buy signal. This is near the highest levels during the last 10 years, so a warning sign that the market is overly bullish.
 

Attachments

  • Equity-Curve_21-1-11.png
    Equity-Curve_21-1-11.png
    14.8 KB · Views: 167
  • Relative-vs-SP500_21-1-11.png
    Relative-vs-SP500_21-1-11.png
    27.7 KB · Views: 167
  • Relative-vs-FTSE_21-1-11.png
    Relative-vs-FTSE_21-1-11.png
    27.9 KB · Views: 199
  • SP500_Weekly_21-1-11.png
    SP500_Weekly_21-1-11.png
    155.8 KB · Views: 202
  • BPSPX_21-1-11.png
    BPSPX_21-1-11.png
    44.1 KB · Views: 176
Vedanta (VED) – Stopped Out

Unfortunately Fridays big down move was too much for my long term Vedanta position and my stop loss was hit giving me a just above breakeven trade. I was up as much as 15% at one point on this, but my new rule is try for 30%.

I still believe in it's prospects, so I will look for a possible re-entry at a lower price in the coming months if the price action looks right.

Closing Trade
Exit Date: 28/1/11
Bid Price: £22.8715
Amount: 45 Shares
Exit Commission: £12.50
Sub Total: £1016.72
Dividend: £5.57
Total: £1022.29

Profit/Loss: £8.51
Percentage Gain/Loss: 0.84%

Daily Keltner Channel Captured: 8%
Trade Grade: C-
 

Attachments

  • VED_28-1-11_exit.png
    VED_28-1-11_exit.png
    83 KB · Views: 206
Month End Update

January was a volatile month, but my account was fairly robust and didn't suffer too badly, only falling -1.94%. The sale of Antofagasta on 4th Jan turned out to be the right decision as it was the high of the uptrend and has fallen 13.2% since then, so if I'd held on to it I would be 10% down now. So I'm happy about that. I'm a bit disappointed that Vedanta was stopped out around my breakeven point as it was performing well, but it's very volatile so the gains disappeared once the volatility started coming back into the market. Randgold Resources is still the laggard. Am regretting getting back in so soon after closing my previous position, but that's the way it goes sometimes. The entry was around 253 day moving average so am confident it will work out fine, will just take some time.

The star performer is still Nickel, which my core position is up 22.26%. But today it reached a major resistance level over the last 5 years, so I have been in two minds whether to take some profits as a corrective period is likely. However, I've decided to stay with it as it is showing excellent relative strength still and I'm determined to run my winners for a change.

Performance

ISA YTD: -1.94%
S&P 500 YTD: +2.26%
FTSE 100 YTD: -0.63%

Relative performance has flattened out on against the FTSE, but the S&P 500 is still outperforming my account. So I need to work on this.

There's been down trend for the last two months in my account which I need to turn around. I'm around 35% in cash at the moment with the two trades closed this month, so I'm looking to reallocate, probably into energy first during February if we have a decent pullback.

Below are the charts
 

Attachments

  • Relative-vs-FTSE_31-1-11.png
    Relative-vs-FTSE_31-1-11.png
    28 KB · Views: 179
  • Relative-vs-SP500_31-1-11.png
    Relative-vs-SP500_31-1-11.png
    27.8 KB · Views: 174
  • Equity-Curve_31-1-11.png
    Equity-Curve_31-1-11.png
    14.8 KB · Views: 182
  • Monthly-Perf_31-1-11.png
    Monthly-Perf_31-1-11.png
    6.6 KB · Views: 169
Hi Isatrader, it is interesting reading through your journal how you are approaching this investment. I had always viewed charting as only being useful for short term trades as the patterns formed are the perceived value of the company not the other way around. I see there is a lots of literature on charting patterns etc but I must admit to being sceptical (not to say I'm wrong :) ). I wonder if there are publications that show historical probabilities for various patterns as to what happened next? I think not because it is very subjective what one person views as say a "head and shoulders" and the next person does not etc - the reason I ask... even though I know there will be no such publication is because there are many books on charting and how is somebody able to say "this pattern has happened so the next likely direction will be X" given no numerical proof (especially when the waters are muddied by so many other external factors)? Though you are making a profit overall and you did do well during the bear market there must be some merit to what you are doing - I suspect this is what your Sharpe ratio confirmed?

You mention earlier in your thread that with the cheaper brokers you tended to get a worse price. I cannot see evidence of this in your list of previous trades on the first page? Interactive investor for example offer a £1.50 option but it has to be on a specific day (4 different days a month). I think you mentioned you are now trading for longer periods of time, does 1-2 weeks make that much of a difference to your profit and loss overall?...rephrased: Do you find you are accurately working out optimum entry and exit (worth researching perhaps)? If not then £1.50 could look value to me. From what I understand the FSA enforces brokers to guarantee best execution?

Earlier you mention that in your experience ETF's don't track very well - is this index or stock ETFs or both? Do you know a website where the tracking error can be ascertained (or ETFs compared etc)? how did you form this opinion? I was hoping ETF's may be useful for my own investments so sorry for all the questions.

Please don't misinterpret my questions, they are not criticisms, just thoughts I had while reading through... I definitely cannot judge as I have not even started on my own venture yet, so you can scoff at my ideas once I get started :)
 
Hi Isatrader, it is interesting reading through your journal how you are approaching this investment. I had always viewed charting as only being useful for short term trades as the patterns formed are the perceived value of the company not the other way around. I see there is a lots of literature on charting patterns etc but I must admit to being sceptical (not to say I'm wrong :) ). I wonder if there are publications that show historical probabilities for various patterns as to what happened next? I think not because it is very subjective what one person views as say a "head and shoulders" and the next person does not etc - the reason I ask... even though I know there will be no such publication is because there are many books on charting and how is somebody able to say "this pattern has happened so the next likely direction will be X" given no numerical proof (especially when the waters are muddied by so many other external factors)? Though you are making a profit overall and you did do well during the bear market there must be some merit to what you are doing - I suspect this is what your Sharpe ratio confirmed?

You're right I'm a very technical analysis based trader and I use a variety of methods to pick a trade which I developed over the years from reading various books like Come into my Trading Room by Elder. I didn't take a lot of notice of fundamental analysis when I started as, as you'll notice from my list of trades I rarely traded many stocks to begin with. I started with just silver in 2007, and then when I got serious about doing it in Summer 2008 it was mainly commodity based ETFs especially Silver, Gold, Nickel, Natural Gas and Oil. This has changed for me in the last year though as commodities ETFs are traded in dollars, and I realised that the rising exchange rate in the Pound vs the Dollar was dampening my profits. For example the price of Silver would go up 10% in dollar terms but in pounds I only made 2%, so all my good trades were harder to achieve a good profit from. A good example of this in my current portfolio is my Nickel trade. It is up to $33.44 from $24.40 when I bought it in July last year, so that's a 37% profit. But, unfortunately the pound has risen as well as Nickel, so my actual profit is only 31% on that trade so far. If you add the trade fees on top of that and the bid/ask spread when I bought it, then it's down to 29.7%. So over 7% is lost to fees and to exchange rate change.

As for patterns and probabilities of moves in a certain direction, they do exist and can be found every day. But it is just one piece of the puzzle as there are many other variables to consider. I think a quote from Reminiscences of a Stock Operator (essential reading by the way) will help:

"A trader, in addition to studying basic conditions, remembering market precedents and keeping in mind the psychology of the outside public as well as the limitations of his brokers, must also know himself and provide against his own weaknesses."

That says it better than I can.

The sharp ratio just confirmed what is quite evident to see on my equity chart. My first year on the chart had wild swings each month and in the second year I got my monthly draw downs under control to around a maximum of -3%, however, as my profits were being dampened by the exchange rate reversal and over trading in an account with high fees the sharp ratio was very low. I haven't looked at it for a while but I imagine the changes I implemented in October last year will produce a much higher sharp ratio now as I've been steadily growing the account with small draw downs. I will have to have a look at that again.

Hope that's helpful, I'll answer the other part of your question tomorrow.

Cheers
 
You mention earlier in your thread that with the cheaper brokers you tended to get a worse price. I cannot see evidence of this in your list of previous trades on the first page? Interactive investor for example offer a £1.50 option but it has to be on a specific day (4 different days a month). I think you mentioned you are now trading for longer periods of time, does 1-2 weeks make that much of a difference to your profit and loss overall?...rephrased: Do you find you are accurately working out optimum entry and exit (worth researching perhaps)? If not then £1.50 could look value to me. From what I understand the FSA enforces brokers to guarantee best execution?

The list of trades only shows the actual entry price, trade fee and stamp duty if a stock. It doesn't show for example that I was charged an extra fee of 1.5% when I traded dollar based ETFs at TD Waterhouse for currency exchange. This is not the case at other providers like for example Selftrade. There's no exchange rate fee there which is one of the reasons why I transferred back to them. So if you look at trade 45 and 47 in my list which was PHAU.L (which is the gold ETF on the London stock exchange), TD took an extra £49 in exchange rate fees on top of the exit commision of £7. So it cost me £56 to close the trade. Which is ridiculous. It doesn't show in the spreadsheet as it was taken off the exit price so it doesn't show up as an extra fee.

I can't speak to whether Interactive investor is any good as I have not used them myself.

On whether timing entries and exits is important. To me it is, but if you plan to average in to a stock using their regular investment service then you will get an average price, but less fees. I personally like to buy around the 200 day moving average if it's a long term holding at the moment of my choosing. My only problem with what you are suggesting is the loss of control of the entry point.

Best execution is also another grey area I think. I found I got much more slippage with certain brokers, and that can cost you a percent here or there so your bulk investment option might be less prone to that.
 
Earlier you mention that in your experience ETF's don't track very well - is this index or stock ETFs or both? Do you know a website where the tracking error can be ascertained (or ETFs compared etc)? how did you form this opinion? I was hoping ETF's may be useful for my own investments so sorry for all the questions.

ETFs are great and I trade them all the time. However, you need to know what you are trading with. Anyway, I think a picture says a thousand words. Here's the performance charts for four commodities I've traded that you can create for free at stockcharts.com

You can do it for stocks and indexes as well, but natural gas and oil are the worst for it and gold and silver track the best I've found, especially the physically backed ones. See attached charts
 

Attachments

  • Perfchart_NATGASUNG.png
    Perfchart_NATGASUNG.png
    12.7 KB · Views: 182
  • Perfchart_WTICUSO.png
    Perfchart_WTICUSO.png
    12.4 KB · Views: 160
  • Perfchart_GOLDGLD.png
    Perfchart_GOLDGLD.png
    11 KB · Views: 189
  • Perfchart_SILVERSLV.png
    Perfchart_SILVERSLV.png
    10.5 KB · Views: 156
Hi Isatrader,

Thank you for the comprehensive response.

I must admit I hadn't put much thought into the issues of exchange rate losses. I was hoping a case of "swings and roundabouts" over long term but I think I should consider this more. So thanks for pointing that out. I was thinking to use mainly US stocks and ETFs to avoud stamp duty but I suppose now with the exchange rate possible losses it may be advantageous to consider the stamp duty equivalent too (?). I am looking at value trades with the aim of getting out when the considered value is gone so not sure yet how long such investments will last I was thinking a ball park figure of 2-3 years? I have a lot to learn and here is not the right place to put such thoughts.

>It doesn't show for example that I was charged an extra fee of 1.5% when I traded dollar based ETFs at TD Waterhouse for currency exchange

It really Annoys me how much these companies are out to rip us off! Especially in today's electronic age, there is no real need for a broker anymore (imo). We should have direct access to exchanges, perhaps a small fee to keep the exchange functional. I was thinking it shouldn't cost more than 10p a trade would easily cover such costs (considering the number of trades per year they all boast)! Complete rip off, but suppose we are bound by the rules! Maybe things will improve in the coming years? I hope......

Thanks for the mention of stockcharts.com. I'll take a look there, should be very useful. I am amazed at the tracking error in some of those screen shots you sent. Especially with these being commodities (though my knowledge here is very basic)! It seems that the managers of the ETF are more important than the item they are tracking!?
Just had another look at charts, the oil one says "Fund" if this is a managed fund (not a tracker) then I can understand there being a big difference? Is the gas one also a managed fund?

All the best,

Getafix.
 
Top