isatrader
Senior member
- Messages
- 2,965
- Likes
- 136
Hi Isatrader
It's good to see a longer term technical trader on these boards who uses similar techniques to my own. (I do not use so many indicators on my charts though). Keep up the good work 👍
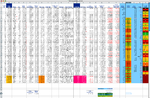
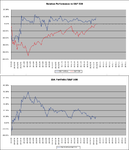
I breakout trade placing limit orders with my broker and pyramiding positions using technical entries to do so. I reduce risk by using a 1% risk per trade rule which allows me to pyramid without excessive risk on each trade. I also calculate monthly and annualised returns against the FTSE 100 as I am a trader of UK shares and also use sharpe ratio to keep myself in check.
Lots of luck
Tafita
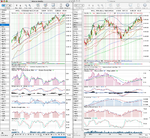
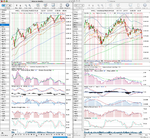
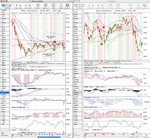
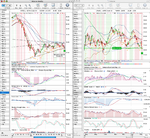
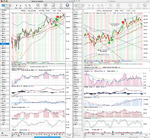
Thanks for the reply. On the subject of indicators, I tend to only really use 2 to 3. Which is rRelative (Price dived by the 200 Day simple moving average), MACD and Force Index (the difference between today's close and yesterday's close multiplied by today's volume). Other indicators such as RSI and Elder Impulse are more for confirmation/warning signals to me, but I never trade off a single indicator. I always have a price reason for entering a trade and just use the indicators to help with timing.