isa's long term trading journal

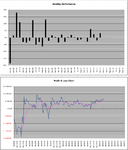
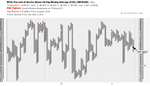
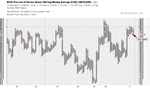
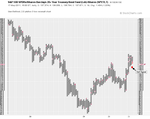
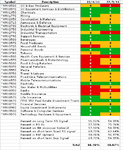
Thanks for the mention of stockcharts.com. I'll take a look there, should be very useful. I am amazed at the tracking error in some of those screen shots you sent. Especially with these being commodities (though my knowledge here is very basic)! It seems that the managers of the ETF are more important than the item they are tracking!?
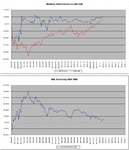
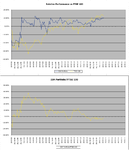
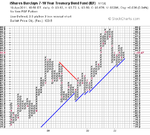
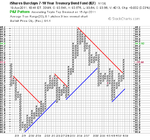
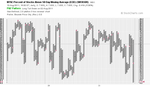
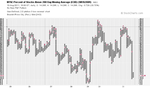
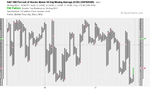
Just had another look at charts, the oil one says "Fund" if this is a managed fund (not a tracker) then I can understand there being a big difference? Is the gas one also a managed fund?

I'll just do a quick response to your last question now as I'm working and reply more later.

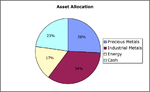
There are various ETF structures. Some are based on derivatives, some have a manager that buys and sells stocks, or futures to try and track an index and some buy and sell physical commodities. The list is more extensive, but you get the idea I'm sure.

Commodities ETFs like oil and natural gas are based on futures contracts, which have to be rolled into the next months contract every month. This causes something they call contango which leads to price disparities with the spot price. Basically energy ETFs are flawed and also leveraged ETFs are flawed as they take a fee every day which gradually eats away at the price especially when the product gets range bound. So for example if you test the leveraged oil etf vs the standard oil etf you'll see what I mean as it doesn't give you 2x the performance and actually is more biased to the downside.
 
Thanks isatrader, my Rookie status definitely shining through lol. I certainly have a hell of a lot to learn :). Quite overwhelming all the possible vehicles for investment. I think I will have to take a simplistic view with my own stuff to begin. Perhaps choosing the companies and then deciding best way to invest - hopefully it'll all start to fall in place little by little.
 
Simple is probably best to begin with. Set yourself up a free test portfolio on ADVFN or Digital Look or another free service and then you'll start to get a feel for how the markets move day to day and be more confident when you put you actual money down.
 
ISA Tradable Mining and Oil Stocks

I found this list in another forum and thought it would come in handy as I like to trade the mining and oil sectors. Apologies to the author of the list as I can't remember where I found it.

UK listed mining and oil stocks that can be purchased in an ISA

Oil/gas
AEX.....Aminex (oil) www.aminex-plc.com
AEY.....Antrim Energy (oil / gas) www.antrimenergy.com
AFR.....Afren (oil) www.afren.com
BG.......British Gas (gas) www.centrica.co.uk
BNK.....Bankers Petroleum (oil & gas) www.bankerspetroleum.com
BP.......BP (oil) www.bp.com
CAD.....Cadogan Petroleum (oil) www.cadoganpetroleum.com
CAZA...Caza Oil & Gas (oil & gas) www.cazapetro.com
CEO....Coastal Energy (oil & gas) www.coastalenergy.com
CNE.....Cairn Energy (oil & gas) www.cairnenergy.com
DGO....Dragon Oil (oil) www.dragonoil.com
ENQ.....Enquest (oil & gas) www.enquestenergy.com
ESSR...Essar Energy (Oil & gas) www.essarenergy.com
GBP.....Global Petroleum (oil) www.globalpetroleum.com.au
HDY.....Hardy (Oil & Gas) www.hardyoil.com
HOIL....Heritage Oil (oil) www.heritageoilplc.com
IAE......Ithaca Energy (oil) www.ithacaenergy.com
JKX......JKX oil and gas (oil & gas) www.jkx.co.uk
MRS....Melrose Resources (Oil & Gas) www.melroseresources.com
OEX.....Oilex (oil) www.oilex.com.au
PMO....Premier Oil (oil) www.premier-oil.com
RDSB...Royal Dutch Shell (oil) www.shell.com
RRL.....Range Resources (oil) www.rangeresources.com
SIA......Soco International (oil) www.socointernational.co.uk
SMDR..Salamander Oil & Gas (oil & gas) www.salamander-energy.com
SQZ.....Serica Energy (oil) www.serica-energy.com
TLW....Tullow Oil (oil) www.tullowoil.com
XEL.....Xcite Energy (oil) www.xcite-energy.com

Coal / mainly coal
CZA.....Coal of Africa (coal) www.coalofafrica.com
NWR....New World Resources (coal) www.newworldresources.eu
PTMN...Petmin (Coal, Iron and Silica) www.petmin.co.za
UKC....UK Coal (coal / land) www.ukcoal.com
WTN....Western Coal Corp (coal) www.westerncoal.com

Uranium
BKY.....Berkeley Minerals (uranium) www.bmrplc.com
FTE......Forte Energy (uranium) www.forteenergy.com.au
GCL.....Gieger Counter Limited (Uranium fund) www.ncim.co.uk/GCLhome.shtml

Gold / mainly gold
ABG....African Barrick Gold (Gold) www.africanbarrickgold.com
AGLD...Allied Gold (gold) www.alliedgold.com.au
AVM....Avocet Mining (gold) www.avocet.co.uk/
CEY.....Centamin Egypt (gold) www.centamin.com.au
CLF......Cluff Gold (gold) www.cluffgold.com
CRND...Central Rand Gold (gold) demo.crg-sa.com
EGU....European Goldfields (gold) www.egoldfields.com
GAL.....Galantas Gold (gold) www.galantas.com/corporate
GPM....Golden prospect Precious Metals (gold/PMs mining fund) www.ncim.co.uk/GPPMhome.shtml
GSL.....Greystar Resources (gold/silver) www.greystarresources.com
HRM....Harmony Gold Company (gold) www.harmony.co.za
KGI.....Kirkland Lake Gold (gold) klgold.com
KLG....Kalimantan Gold (coal & gold) www.kalimantan.com
LRL.....Leyshon Resources (gold) leyshonresources.com
MIRL....Minera IRL (gold) www.minera-irl.com
MML....Medusa Mining (gold) www.medusamining.com.au
NYO.....Nyota Minerals (gold) www.nyotaminerals.com
OMI.....Orosur Mining (gold) www.orosur.ca
OSU.....Orsu Metals (gold / copper) www.orsumetals.com
PAF.....Pan African Resources (gold) www.panafricanresources.com
POG....Petropavlovsk (gold & iron ore) www.petropavlovsk.net
RMM....Rambler Metals (gold / copper) www.ramblermines.com
RRS.....Randgold Resources (gold) www.randgoldresources.com
SGZ.....ScotGold (gold) www.scotgoldresources.com
YAU....Yamana Gold (gold) www.yamana.com

Silver / mainly silver
AGQ.....Arian Silver (silver) www.ariansilver.com
FRES...Fresnillo (silver/gold) www.fresnilloplc.com
HOC.....Hochschild mining (silver) www.hochschildmining.com

Platinum / mainly platinum
AQP.....Aquarius Platinum (platinum) www.aquariusplatinum.com
ELR.....Eastern Platinum (platinum) www.eastplats.com
JLP.....Jubilee Platinum (platinum) www.jubileeplatinum.com
LMI......Lonmin (mainly platinum) www.lonmin.com
PPN.....Platmin Ltd (platinum) www.platmin.com
SLV.....Sylvania Resources (platinum) www.sylvaniaresources.com

Diamonds
GEMD..Gem Diamonds (diamonds) www.gemdiamonds.com
NAD.....Namakwa Diamonds (diamonds) www.namakwadiamonds.co.za

Copper / mainly copper
ANTO...Antofagasta (mainly copper) www.antofagasta.co.uk
DME....Discovery Metals (copper) www.discoverymetals.com.au
EMED...Emed Mining (copper/gold), to list in Toronto www.emed-mining.com/site
FND.....Finders Resources (copper) www.findersresources.com
MNC....Metminco (copper/gold/molybdenum/zinc) www.metminco.com.au
RMM....Rambler Metals (gold / copper) www.ramblermines.com

Nickel
TALV...Talvivaara (Nickel) www.talvivaara.com

Iron ore / mainly iron ore
AAAM..African Aura (iron ore / gold / diamonds) www.african-aura.com
AYM....Anglesey Mining (iron ore, zinc, copper) www.angleseymining.co.uk
FCR.....Ferrum Crescent (iron ore) www.ferrumcrescent.com/
FXPO...Ferrexpo (iron ore) www.ferrexpo.com
LOND...London Mining (iron ore & coking coal) www.londonmining.co.uk

Ferrochrome:
IFL......International Ferro Metals (ferrochrome producer) www.ifml.com

Titanium:
KMR....Kenmare Resources (titanium) www.kenmareresources.com

Tantalum:
NVTA...Noventa (Tantalum) www.noventa.net/

Various / multi-commodity:
AAL.....Anglo American (multi commodity) www.angloamerican.co.uk
APF.....Anglo Pacific (various) www.anglopacificgroup.com
BLT......BHP Billliton (multi commodity) www.bhpbilliton.com
BRCI ...Blackrock Commodities Income (multi commodity) www.blackrock.co.uk
BRWM.Blackrock World Mining Trust (multi commodity trust) www.blackrock.co.uk
CYN......City Natural Resources High Yield Trust (mining and resource equities, resources and industrial fixed interest securities) www.ncim.co.uk/CNRhome.shtml
ENRC...Eurasian Natural Resources Corp (multi commodity) www.enrc.com
KAZ.....Kazakhmys (multi commodity miner incl copper and silver) www.kazakhmys.com
NUS.....Nautilus Minerals (various metals, undersea mining) www.nautilusminerals.com
POL.....Polo Resources (uranium & coal) www.poloresources.com
RIO......Rio Tinto (multi commodity) www.riotinto.com
VED....Vedanta (multi commodity) www.vedantaresources.com
XTA.....Xstrata (multi commodity) www.xstrata.com

I didn't create the list personally, so I'm not sure if it's 100% correct or not.
 
Last edited:
Month End Update

Nickel continues to be my best holding, but the rise in the Pound has dampened the profits somewhat by around 7-8%. Seasonally, we are into the strong period according to some historical analysis I've read from the Moore Research Center. March, April or July are typically the highs for Copper, and Nickel tracks copper fairly closely, but with more volatility as it's a thinner market. It seems very much like the relationship between Gold and Silver IMO. So I'm looking to sell half my position in the next few months. The core position however, I plan to hold long term.

The OILW ETF continues to underperform. Even with $100 oil it is still is at -8.36% and I bought it when Oil was below $90. The rise in the Pound is again to blame as well as contango from the futures contract rollovers in the ETF.

Randgold Resources has also been weak, but it seems to have found a base around 5000. So with the continued high Gold prices, they are making huge profits, so there's every reason for it to continue higher after this pullback has played out.

I still have 23% of my account in cash, so I'm looking to add new positions in the coming month and get fully invested again.

Open positions
NICK.L (ETFS Nickel): +29.65% (37.25% in dollars)
NICK.L (ETFS Nickel): +15.12% (19.82% in dollars)
OILW.L (ETFS Oil 2 Month): -8.36% (-0.71% in dollars)
RRS.L (Randgold Resources): -12.77%

Account Performance

February
ISA: +3.05%
S&P 500: +3.20%
FTSE 100: +2.24%

Year to Date
ISA: +1.05%
S&P 500: +5.53%
FTSE 100: +1.60%

Below is the charts and trades details
 

Attachments

  • Equity-Curve_28-2-11.png
    Equity-Curve_28-2-11.png
    21.7 KB · Views: 168
  • Trades_spreadsheet_28-2-11.png
    Trades_spreadsheet_28-2-11.png
    8.9 KB · Views: 161
  • Relative-vs-SP500_28-2-11.png
    Relative-vs-SP500_28-2-11.png
    28 KB · Views: 190
  • Relative-vs-FTSE100_28-2-11.png
    Relative-vs-FTSE100_28-2-11.png
    28.2 KB · Views: 189
  • asset_allocation_28-2-11.png
    asset_allocation_28-2-11.png
    8.5 KB · Views: 193
ANTO.L Entry

Ticker: ANTO.L
Entry Date: 4/3/11 @ 13:06:30
Amount: 68 Shares
Entry Price: £14.496204
Commission: £12.50
Stamp Duty: £4.93
Total: £1,003.17

Below is the charts
 

Attachments

  • ANTO_4-3-11_Entry.png
    ANTO_4-3-11_Entry.png
    161.6 KB · Views: 206
  • SharpChartv05-12.png
    SharpChartv05-12.png
    22.3 KB · Views: 181
SEMB.L Entry

Trade

Ticker: SEMB.L (iShares JPMorgan $ Emerging Markets Bond Fund)

Entry Date: 15/4/11 @ 13:31
Amount: 31 Shares
Entry Price: £64.647
Commission: £12.50

Total: £2,016.56

Dividend Yield: 6.44%
Monthly dividend payments of approx 0.5%

Entry Reason
I recently withdrew 75% of my spread betting account as I realised that at the small sizes I was trading (0.5% per trade and max risk of 3% a month), that the majority of the cash in the account was just sitting there making the spread betting company interest and me nothing, and it was also at risk if there was a black swan event. So I took out three quarters of the account and moved it into my ISA with the intention of earning some interest on the money. So I've chosen the iShares JPMorgan $ Emerging Markets Bond Fund for part of the money as I traded it last year and it pays monthly dividend payments of around 0.5% (5.95% in the last 12 months).

Another reason for my timing with this is that we are getting near to May when you can sometimes get a risk off trade for the summer months, so it will add some protection to my portfolio if there is any kind of sell off, as that looks a possibility at the moment IMO.
 

Attachments

  • FFS_FI_SEMB_IE00B2NPKV68_GB_en.pdf
    291.4 KB · Views: 455
Last edited:
Risk Off coming soon?

I've noticed some key changes in the S&P 500 and the iShares Barclays 20+ Year Treasury Bond ETF, which give a good gauge of the risk on and risk off trade. It looks to me that the market is starting to move back to a risk off phase so I'm going to add some more protection to my account as who knows how long it will take to play out.
 

Attachments

  • SP500_18-4-11.png
    SP500_18-4-11.png
    88 KB · Views: 185
  • TLT_18-4-11.png
    TLT_18-4-11.png
    87.1 KB · Views: 181
Trade

Ticker: IBTM.L (iShares Barclays Capital $ Treasury Bond 7-10)

Entry Date: 19/4/11 @ 15:36
Amount: 19 Shares
Entry Price: £107.5544
Commission: £12.50

Total: £2,056.03

Dividend Yield: 3.27% (Semi Annual payments)

Entry Reason
I wanted to trade TLT which is the iShares Barclays 20+ Year Treasury Bond Fund, but after a phone call to my broker I found out that it isn't eligible in an ISA, which was really annoying. So I investigated the options available to UK investors and we can only invest in the 7-10 year US Treasury Bond or shorter which trades under the ticker IEF in the US, but the UK version is IBTM.L and has rubbish volume and doesn't pay a monthly dividend like the US one.

I've included the IEF chart as the trading volume is vast in comparision to the IBTM.L so gives a better representation on the chart and volume indicators.
 

Attachments

  • IEF_Daily_PnF_19-4-11.png
    IEF_Daily_PnF_19-4-11.png
    25.5 KB · Views: 169
  • IEF_30min_PnF_19-4-11.png
    IEF_30min_PnF_19-4-11.png
    26.9 KB · Views: 171
  • IEF_Daily_19-4-11.png
    IEF_Daily_19-4-11.png
    150.7 KB · Views: 175
Possible solution for hedging ETFs priced in Dollars?

I've been looking into possible ways of hedging my US dollar exposure in my ISA portfolio as it has become more and more of a problem over the last few years. My position in Oil for example was purchased via the OILW.L etf last April when the GBP/USD rate was around 1.5076; today it closed near 1.6500 - so the Pound is up almost 9.5% since I bought the OILW.L etf in April 2010 dampening my profit. This isn't the only problem with the oil position as contango has been a big factor as well so I'm currently only just at breakeven on this position which is rubbish considering the rise in oil over the last 6 months.

So as the example shows I need to address this issue and would like to hedge the dollar exposure I have in the portfolio as every time I buy an ETF priced in dollars I'm effectively going long the dollar at the same time. The problem has been how to actually achieve this within the ISA wrapper, but I think I've found a possible solution via the ETF Securities currency ETFs which were introduced 6 months ago. They have two types of currency ETF. A normal ETF that tries to track the price of the pairs and some 3x leverage ETFS. This is what the website says about the 3x short Dollar, long Pound ETF:

ETFS 3x Short USD Long GBP is designed to track the MSFXSM Triple Short US Dollar/GBP Index (TR). This index aims to reflect three times the daily percentage change between the two currencies, plus generates a collateral yield on the cash invested.

Here's a link to the products info page: http://www.etfsecurities.com/fxl/3x/etfs_3x_short_usd_long_gbp.asp

My worry with a leveraged ETF is that it may not produce the 3x daily percentage change very accurately and as there's no historical data to compare against all I have is 6 months of very low volume data to look at. It appears to track reasonably well so far, but the GBP/USD has been in an uptrend for most of the time since it's inception so I have no guide as to how well it tracks once it's range bound. But it seems the only option I have within an ISA unless someone knows of anything better I could do??

I currently have around £3k invested in dollar denominated ETFs, so my plan is to wait for a while as we are due some risk off time in the market which should in theory bring the pound back down a bit and then hedge part or all of the dollar exposure using the ETFS 3x Short USD Long GBP (PUS3.L).

If anybody knows of a better cheaper way of hedging dollar exposure within an ISA then let me know?

Cheers
 
FTSE 350 Sector Matrix

I've recently been reading a lot about relative strength analysis, and particularly the Dorsey method using relative strength point and figure charts has been of great interest to me. I've been experimenting for a while now using stockcharts.com charts on various stocks, but I wanted to be able to look at the FTSE 350 sectors and that's not possible on stockcharts site, so I've had to go the manual route and have spent days downloading the data for each sector and putting each one into individual excel spreadsheets to create relative strength charts versus the FTSE 100.

From the charts I've created a matrix of buy and sell signals using various point and figure metrics on long and short term timescales. My aim with this is to create a long term sector rotation tool that I can use to see which sectors to overweight and which to underweight in my portfolio.

I'm using 3 P&F chart types - Relative Strength versus FTSE 100 on a percentage and fixed scale and a more standard P&F chart. From these I've seperated it into two sections for each chart type with a long term and short term signal making a total of 6 columns. The final 3 columns on the matrix give the scores for the long and short term signals out of 3 and the overall signal out of 6.

My thinking is that I can mirror the totals on another sheet and then place the results side by side each week or month so I'll be able to easily see when a sector changes score. For example if a sector moves from a score of 5 to a score of 6 then I'd interested in buying it depending on further relative analysis against the other outperforming sectors. But if however, a sector I own moves from a 6 to a 4, then I'd want to tighten my stop loss or sell it depending on what the other sectors and the market are doing.

I also think the overall percentages for each analysis could be useful for gauging the overall market strength and could give me another idea of when to play offense and when to play defense in the market.

So my plan is to create a portfolio of sectors, I'm thinking a small selection of five sectors, which I will rotate depending on the relative strength of the sectors using the matrix I've created as a guide and my other normal methods to manage the positions.

The goal with this portfolio will be to outperform the FTSE 100. Back testing of similar strategies by Dorsey on US sectors have shown them to outperform in the long term so I hope I can make it work for the UK sectors.

Attached is the current matrix.
 

Attachments

  • FTSE350_Sector_Matrix-24-4-11.png
    FTSE350_Sector_Matrix-24-4-11.png
    19.1 KB · Views: 188
  • FTSE350_Sector_Scores-24-4-11.png
    FTSE350_Sector_Scores-24-4-11.png
    6.1 KB · Views: 183
Last edited:
Nickel – Exit

As I've mentioned previously I've getting more bearish over the last month and moved half my portfolio to bonds a few weeks ago. But this weeks price action and the NYSE bullish percent index being close to reversing below the crucial 70 level have made even more bearish, so I've decided to take my risk off the remaining stock positions so that half the portfolio will be in cash and half in bonds. This will hopefully for the first time put me in the right position to think about new positions again once the move lower moves back into the stage 1 phase again.

My Nickel position gave a weekly volume sell signal 5 weeks ago but I gave it a chance to see if it could bounce at the recent lows as the market was still moving higher. However, the commodity sell off sparked by silver reaching its peak last week is dragging all commodities down and the turn in the dollar today broke the back of the commodities trade so I decided to take the small profit I had before it turned into a big loss.

Closing Trade
Ticker: NICK.L

Trade 1
Entry Date: 27/7/10
Entry Price: £15.7242 ($24.40 @ fx rate 1.5521)

Trade 2
Entry Date: 7/12/10
Entry Price: £17.7091 ($27.95 @ fx rate 1.5790)

Exit
Exit Date: 5/5/11
Bid Price: £17.2505 ($28.45 @ fx rate 1.6474)
Amount: 117 Shares
Exit Commission: £12.50

Total: £2005.81

Profit/Loss: £31.91
Percentage Gain: 1.61%

Daily Keltner Channel Captured: 15%
Trade Grade: C

Unfortunately the majority of my gain on this one was eaten up by the rise in the Pound vs the Dollar. It was something I didn't know much about when I bought the ETF in the middle of last year. But it shows that I need to hedge my dollar exposure when I trade products priced in dollars as otherwise good trades like this one will end up not doing much.

Below is the weekly chart of the whole trade.
 

Attachments

  • NICK_exit_5-5-11.png
    NICK_exit_5-5-11.png
    94.8 KB · Views: 179
  • SharpChartv05-1.png
    SharpChartv05-1.png
    32.6 KB · Views: 162
The dollar is very close to a major reversal............and also what I have been reading that I respect says that the bond market is in a bubble and it will be the next to fall............

Good Trading,
JahDave
 
Risk Off

I've gone to full risk off for my portfolio and used today's strength to sell out of my remaining commodity related positions in Oil (OILW.L), Antofagasta (ANTO.L) and Randgold Resources (RRS.L).

I still took a hit on all three but I think they've got further downside from here so I wanted to get out now. Therefore, I now have only High Yield Emerging Market Bonds and US Treasury 10 year Bonds which I purchased a few weeks ago and are now starting to show a profit as the dollar has turned up this week.

This means that I can take some time over the next few months to consider new positions as I have cash available from today's sales.

The account is at the break even level so I'm in no hurry to do anything as I think the biggest lesson I've learned over the last few years is that market timing is crucial. So I'm going to try and be patient and get back in to stocks when I think the risk reward is better.
 

Attachments

  • Equity-Curve_6-5-11.png
    Equity-Curve_6-5-11.png
    22.3 KB · Views: 166
Risk Off coming soon?

The long term market breath charts I use to gauge risk are at a possible tipping point and could go either way here. The NYSE Bullish Percent Index (which is a breadth indicator based on the number of stocks on Point & Figure buy signals within the New York Stock Exchange) is only 0.24% away from going bearish for the first time since the buy signal in September. Whereas the NYSE Percent of Stocks above their 200 day moving average and SPY/TLT ratio are also close to doing the same. The NYSE Percent of Stocks above their 50 day moving average has already gone bearish but is obviously a shorter term signal so has less validity.

The S&P 500 has also closed below the 2 year uptrend line today, so unless the market can break above again quickly I think we could be in for more significant correction. So in my long term portfolio I'm going to stay in the US treasury 7-10 year ETF that I'm currently in and the Emerging markets bond fund as both have an inverse relationship to the market and have moved into profit over the last few weeks while the equities have been declining. I'm going to stay at cash for the rest of the account and wait for the down move to play out and hopefully it will present some opportunities in stocks in the next few months or so.
 

Attachments

  • NYSE_Percent50_17-5-11.png
    NYSE_Percent50_17-5-11.png
    17.1 KB · Views: 183
  • NYSE_Percent200_17-5-11.png
    NYSE_Percent200_17-5-11.png
    18.2 KB · Views: 177
  • SPY_TLT_ratio_17-5-11.png
    SPY_TLT_ratio_17-5-11.png
    18.6 KB · Views: 184
  • NYSE_Bullish_Percent_17-5-11.png
    NYSE_Bullish_Percent_17-5-11.png
    17.7 KB · Views: 187
NYSE Bullish Percent Index

The NYSE Bullish Percent Index has given a double bottom sell signal today (19/05/2011). According to the methods I've read about this it signals that the market has the football in the most dangerous field position and it is your job to try and keep the market from scoring against you and taking your money. So as I already moved to a defensive position a few weeks ago, I might add an extra position in the VIX.

Point and Figure Charting by Dorsey has a whole chapter on the Bullish Percent which is very good IMO if you want to understand it better.
 

Attachments

  • SharpChartv05-3.png
    SharpChartv05-3.png
    32.6 KB · Views: 183
Re: NYSE Bullish Percent Index

The NYSE Bullish Percent Index has given a double bottom sell signal today (19/05/2011). According to the methods I've read about this it signals that the market has the football in the most dangerous field position and it is your job to try and keep the market from scoring against you and taking your money. So as I already moved to a defensive position a few weeks ago, I might add an extra position in the VIX.

Point and Figure Charting by Dorsey has a whole chapter on the Bullish Percent which is very good IMO if you want to understand it better.

Hi Isa,

Here are 2 DOW charts,,,,,,,,,,,,,,,,They both show that the DOW is ready to turn down,,,,,,,,,,,,,,,,,,I believe that the DOW has to go below the 6500 from here and my target is 3300...............From an Elliott Wave perspective the DOW should make 13085 before it drops..........
 

Attachments

  • DOW_05_19_2011.png
    DOW_05_19_2011.png
    59.6 KB · Views: 190
  • DOW_05_19_2011_Long.png
    DOW_05_19_2011_Long.png
    44.2 KB · Views: 171
FTSE 350 Sector Matrix

I've updated the FTSE 350 sector matrix I created last month to see what changes in relative strength there's been in the various sectors.

Sectors that made notable moves this month were:

Positive
NMX2710 Aerospace & Defense (+2)
NMX4570 Pharmaceuticals & Biotechnology (+2)
NMX3780 Tobacco (+2)
NMX5330 Food & Drug Retailers (+4)

Negative
NMX0530 Oil & Gas Producers (-2)
NMX1770 Mining (-2)
NMX2770 Industrial Transportation (-3)
NMX9570 Technology Hardware & Equipment (-2)

Looking at the matrix I can see a fair bit of sector rotation last month away from riskier assets to more defensive areas. Only 54.55% of sectors are on short term buy signals now versus 69.70% last month so 5 more sectors are on sell signals than in April. The percent in an uptrend grew to 96.97% though, so 32 of the 33 sectors are now in an uptrend on the standard chart, but a lot of the charts moving averages are very close to crossing to the downside so it could change dramatically very quickly in June if a few start to break down.

Attached is this months matrix and the comparison sheet which shows this months and last months scores together.

For those who didn't see my original post, the best score is 6 and the worst score is 0. So banks are the worst performing sector currently on the matrix.
 

Attachments

  • FTSE350_Sector_Matrix-27-5-11.png
    FTSE350_Sector_Matrix-27-5-11.png
    28.2 KB · Views: 151
  • FTSE350_Sector_Scores-27-5-11.png
    FTSE350_Sector_Scores-27-5-11.png
    8.5 KB · Views: 165
Risk On

My risk off period that started in April when I sold all my stocks and bought the 10 year US treasuries ETF (IBTM.L) and Emerging Market Bonds (SEMB.L) has come to an end. Over the last month I've sold out of both of these for a nice gain in each of around 5% including the dividends I received.

I've now moved to an aggressive risk on mode and have have made 4 separate purchases in Nickel (LNIK.L) and Silver (LSIL.L) over the last two weeks starting on the 3rd August and finishing today as the market breadth indicators that I follow - $BPNYA (NYSE Bullish Percent Index), $NYA200R (NYSE Percent of Stocks above their 200 day moving average) & $NYA50R (NYSE Percent of Stocks above their 50 day moving average) have reached extreme levels that I've been waiting for. I maybe a bit early as theses indicators show that it normally takes a while when you get to these levels to start moving meaningfully higher again, but I'm a believer that this down move is wave 4 in the long term bull trend that started in March 09, and that we will soon start the final wave 5.

I've still got around 40% in cash, so I'll be looking for stocks to buy in the next month or so.

Attached are the breath indicators that I follow
 

Attachments

  • SharpChartv05-7.png
    SharpChartv05-7.png
    28.9 KB · Views: 172
  • SharpChartv05-6.png
    SharpChartv05-6.png
    31.7 KB · Views: 179
  • SharpChartv05-5.png
    SharpChartv05-5.png
    32.9 KB · Views: 195
Breadth indicators turning positive

I'm pleased to see that the market breadth indicators have given some buy signals finally today. The NYSE Bullish Percent Index ($BPNYA) turned up back into a column of Xs and went above the key 30 level, which means that it's time to move back to offense again and use a more risk on strategy. This is backed up by the NYSE Percent of Stocks above their 50 day moving average ($NYA50R) now on a buy signal, the S&P 500 Percent of Stocks above their 200 day moving average ($SPXA200R) and also the S&P 500 Percent of Stocks above their 50 day moving average ($SPXA50R). So I'm going to look for an opportunity to deploy my remaining cash as if you look back through the historical data on these breadth indicators it's clear that these are mostly great places to buy except for a few exceptions like early 2008 when the market is entering a recession, although that still could have been a good place to buy as the market moved up until the summer, so money could have still been made.

Also the S&P 500 and NYSE all stocks charts both made bullish triangle breakouts today so I think the longer term wave 5 I've been waiting for could be underway.

Attached is some of the charts
 

Attachments

  • SharpChartv05-14.png
    SharpChartv05-14.png
    33.3 KB · Views: 158
  • SharpChartv05-15.png
    SharpChartv05-15.png
    29.4 KB · Views: 169
  • SharpChartv05-16.png
    SharpChartv05-16.png
    31.8 KB · Views: 172
  • SharpChartv05-20.png
    SharpChartv05-20.png
    32.9 KB · Views: 156
  • SharpChartv05-21.png
    SharpChartv05-21.png
    29.8 KB · Views: 175
  • SharpChartv05-18.png
    SharpChartv05-18.png
    27.7 KB · Views: 162
  • SharpChartv05-19.png
    SharpChartv05-19.png
    49.6 KB · Views: 170
Top